G DATA Business Solutions: SIEM Plugin Configuration Splunk
Splunk is a paid logging, monitoring and reporting tool for monitoring internal connections.
With the help of this guide, you can pass on security events from G DATA Management Server to your Splunk server (output) via the Telegraf service.
This guide assumes that the inbound configuration as well as the G DATA Management Server configuration has already been done.
Plugin Configuration
Enter data and create a token for HTTP Event Collector. The token is needed to send data. https://docs.splunk.com/Documentation/Splunk/8.0.1/Data/UsetheHTTPEventCollector
1 |
Open Splunk Web. |
2. |
In Splunk Web, click Settings and then Data Inputs. |
3. |
For Local Inputs, click HTTP Event Collector. |
4. |
Make sure that HTTP Event Collector is enabled. 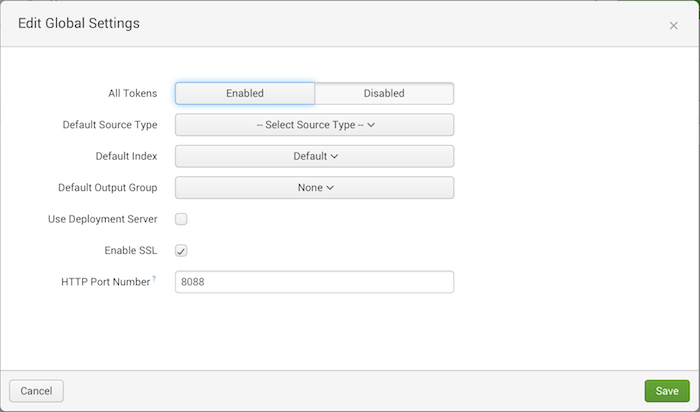
|
5. |
Open the Global Settings. |
6. |
Set All Tokens to Enabled. |
7. |
Click Save. |
8. |
Create an HTTP Event Collector token for sending files. To do this, click New Token. |
9. |
On the Select Source page, enter a token name in the Name field, for example, "Metrics token". |
10. |
Click Next. |
11. |
On the Input Settings page for Source Type, click New. |
12. |
For Source Type, enter the name of your source type. |
13. |
For Source Type Category, select the Metrics option. |
14. |
Optional: enter a description of your source type under Source Type Description. |
15 |
Select the option Metrics Index for Default Index or create a new index. If you want to create a new index, follow the five steps below.
|
16. |
Click Review and then click Submit. |
17. |
Copy the displayed token. |
Telegraf Configuration (Output)
This plugin sends metrics in an HTTP message encoded with one of the output data formats.
1. |
Open the Telegraf configuration file with an editor: C:\Program Files (x86)\G Data\G DATA AntiVirus ManagementServer\Telegraf/telegraf.config with an editor. |
2. |
Adjust the following value: [[outputs.syslog]] ## URL to connect to ## ex: address = "tcp://127.0.0.1:8094" ## ex: address = "tcp4://127.0.0.1:8094" ## ex: address = "tcp6://127.0.0.1:8094" ## ex: address = "tcp6://[2001:db8::1]:8094" ## ex: address = "udp://127.0.0.1:8094" ## ex: address = "udp4://127.0.0.1:8094" ## ex: address = "udp6://127.0.0.1:8094" address = "udp://127.0.0.1:514" The line address = "udp://127.0.0.1:514" must be provided with hashtags: ## address = "udp://127.0.0.1:514". |
3. |
Add the following lines in the Telegraf configuration file after the last line in the OUTPUT PLUGINS section: C:\Program Files (x86)\G Data\G DATA AntiVirus ManagementServer\Telegraf/telegraf.config Output Plugin Configuration More information: https://github.com/influxdata/telegraf/tree/master/plugins/outputs/http. |
4. |
Change line 4 from url = "http://127.0.0.1:8080/telegraf" to "https://hostname:port/services/collector" url = "https://hostname:port/services/collector" |
5. |
If you are working with self-signed certificates, change line 27 from insecure_skip_verify = "false" to "true". Remove the comment out. insecure_skip_verify = true |
6. |
Change the data output format in line 33 from data_format = "influx" to splunkjson. Remove the comment out. data_format = "splunkjson" |
7. |
On line 40, remove the comment. On line 42, change the Content-Type from text/plain; charset=utf-8 to application/json; charset=utf-8. Also at line 42, remove the comment out. |
8. |
Add the following lines after the Content-Type paragraph to receive requests from Splunk. |
9. |
On line 44, for Authorization, enter your created Splunk Web HTTP Event Collector token. Authorization = "Splunk b0221cd8-c4b4-465a-9a3c-273e3a75aa29" |
10. |
Enter any GUID in line 45 for X-Splunk-Request-Channel. This is needed to identify requests. For example, you can create a GUID at this generator X-Splunk-Request-Channel = "5ce64080-dccc-4741-8f32-09cd7ee3191a" |
11. |
Create a new telegraf service using the customized "telegraf.conf". |
Related articles