G DATA MXDR
Dashboard
On the Dashboard, you can view the most important current information at a glance.
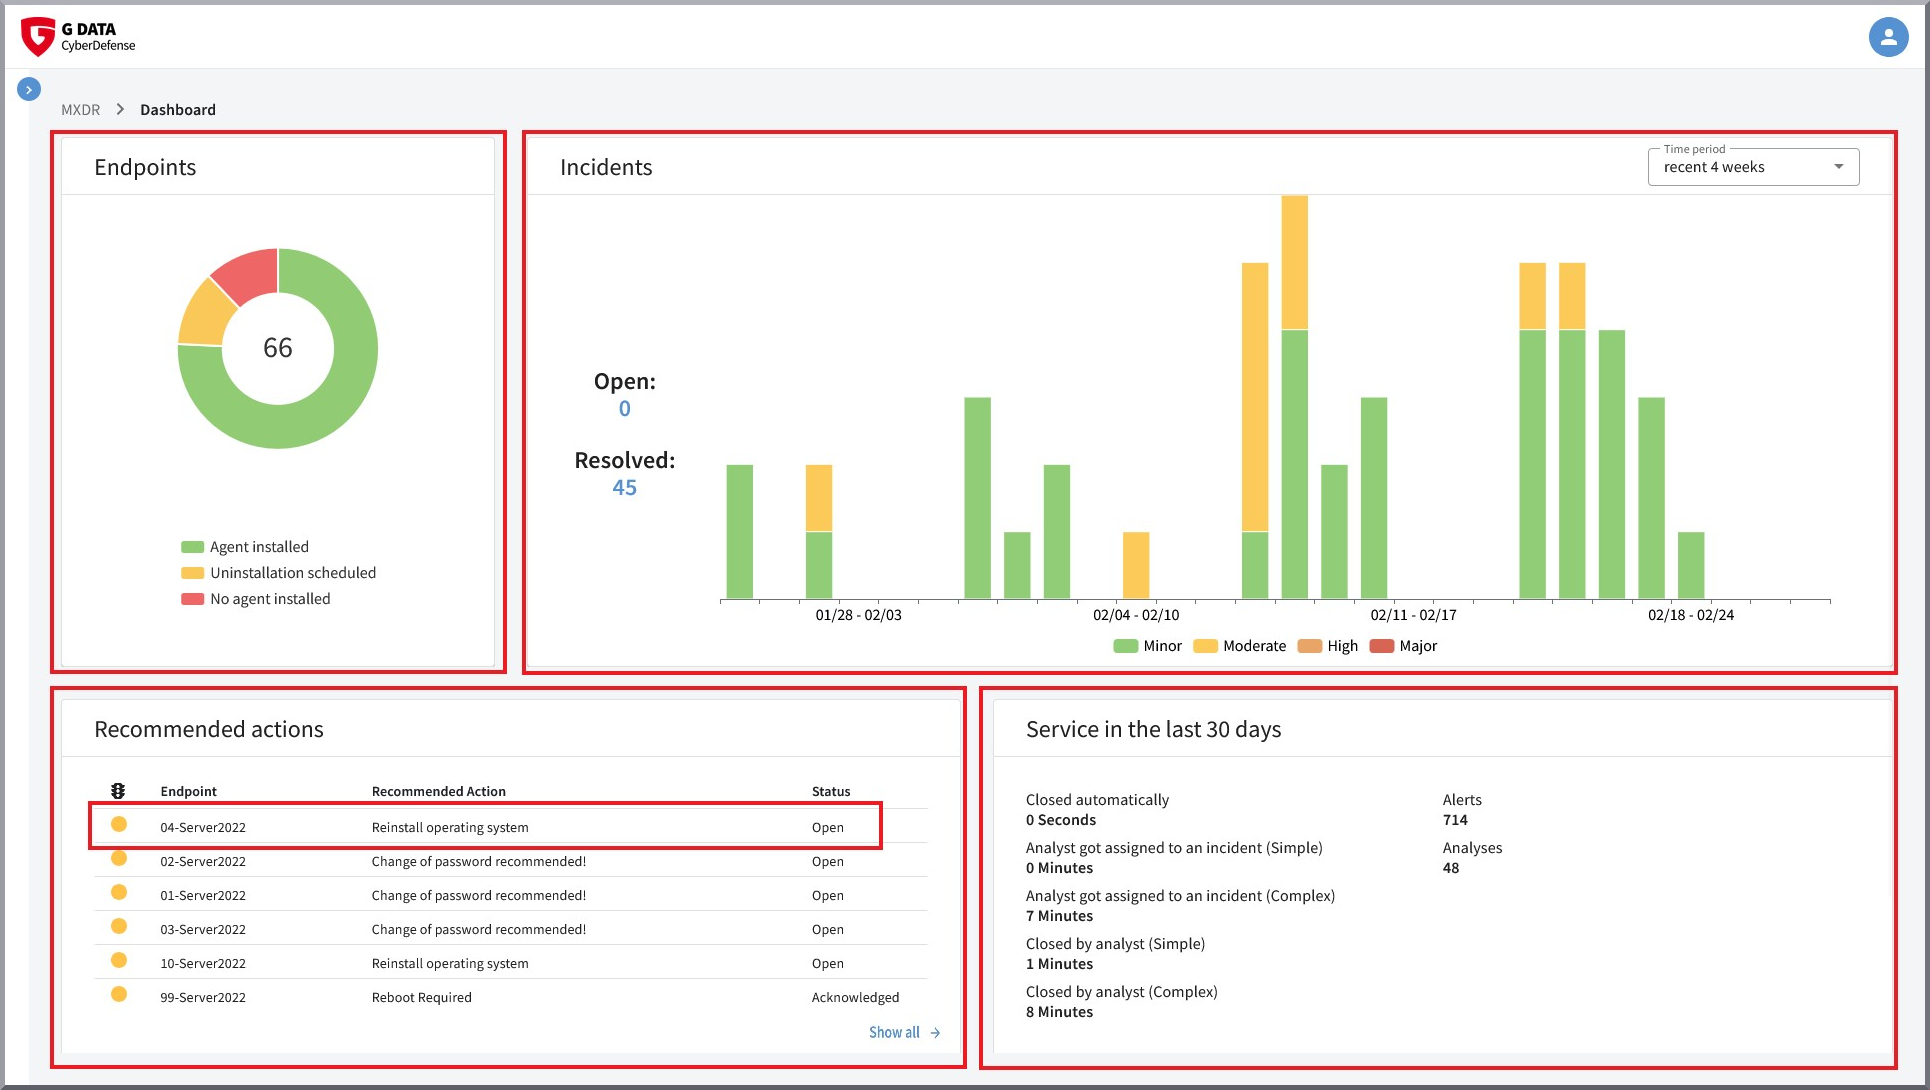
There are four sections here: Endpoints, Incidents, Recommended Actions and the summary of our Service within the last 30 days.
Endpoints
This section lists the total number of endpoints within the tenant. At a glance, you can see on how many endpoints the Agent is installed, grouped by operating systems, and on how many endpoints an uninstallation is scheduled.
By clicking the respective segment, you are taken directly to the Endpoints overview with a preset filter (Windows/Linux/macOS Agent installed | No Agent installed | Uninstallation scheduled). This provides a detailed list of which endpoints meet the respective criterion.
Incidents
This section provides an overview of all recent incidents. You can control the displayed time range using a button; you can display the last 7 days, 4 weeks, 12 weeks, 6 months, or 12 months. Days on which incidents occurred are displayed as a bar chart in which the incidents are aggregated by their impact.
In this section as well, you can click the bar charts to open the view of the incidents with a preset filter (Status Open / Resolved, Impact Low / Moderate / High / Severe).
|
Our classification is based on that of the BSI. In this context, this means:
Further details can be found on the BSI website. |
Recommended Actions
All Recommended Actions are listed here with Priority (traffic-light indicator), affected Endpoint, name, and status. The listed Recommended Actions can be sorted based on the points mentioned. In addition, you can click a list entry to open the details page of the underlying incident for the Recommended Action. By clicking Show all, you are taken directly to the "Recommended Actions" view for a detailed overview.
| Recommended Actions that are grayed out in the list have already been completed. |
Service summary
A brief summary of the service that G DATA and our analysts performed for you within the last 30 days.
This includes the total number of alerts and analyses and how much time our analysts spent on the alerts.
| Please note that an incident can include multiple alerts. |
The items are broken down by automatically closed incidents as well as simple and complex incidents.
In this context, "simple" incidents are incidents that our analysts were able to resolve independently; "complex" incidents required more effort and may have required your involvement.