G DATA MXDR
Retracing Incidents using the Alert Graph
For the follow-up analysis of complex incidents, it can be helpful to examine all involved processes in detail. To make this possible, the G DATA Web-Portal provides the Alert Graph. Here you will find a visualized view for each alert of the respective incident, showing which involved processes initiated other processes.
Which process triggered other processes? What happened to which files on the system? Were changes made in the
Windows Registry and, if so, what exactly changed there? Was there communication to external destinations and, if so, to where?
These questions can be subjected to an in-depth analysis.
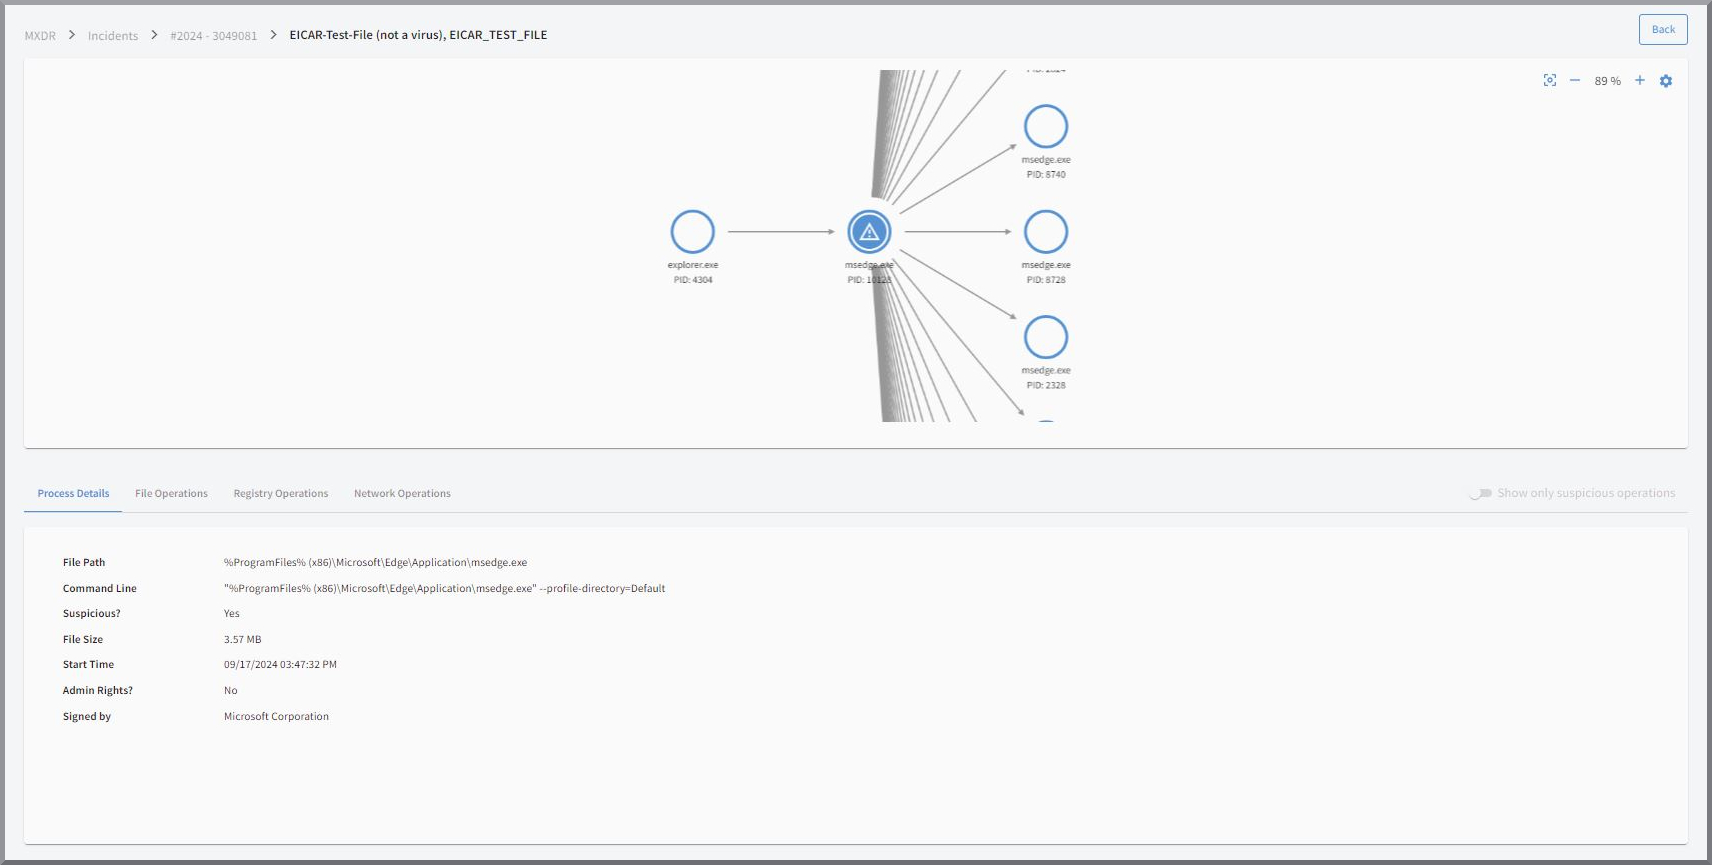
This view shows interactions between processes. In addition, it is possible to view details for individual
processes.
This includes:
-
General process details
-
File operations
-
Operations in the Windows Registry
-
Network operations
| The graph refers to the processes that belong to one alert, not to the processes of all alerts that belong to an incident! |
You can access the Alert Graph in the
incident detail view either via the timeline or the list of
alerts.
Here you can find the documentation for the Alert Graph.