G DATA MXDR
Incident overview
Each incident can be reviewed in its entirety in its detail view. All important information related to the respective incident is summarized here.
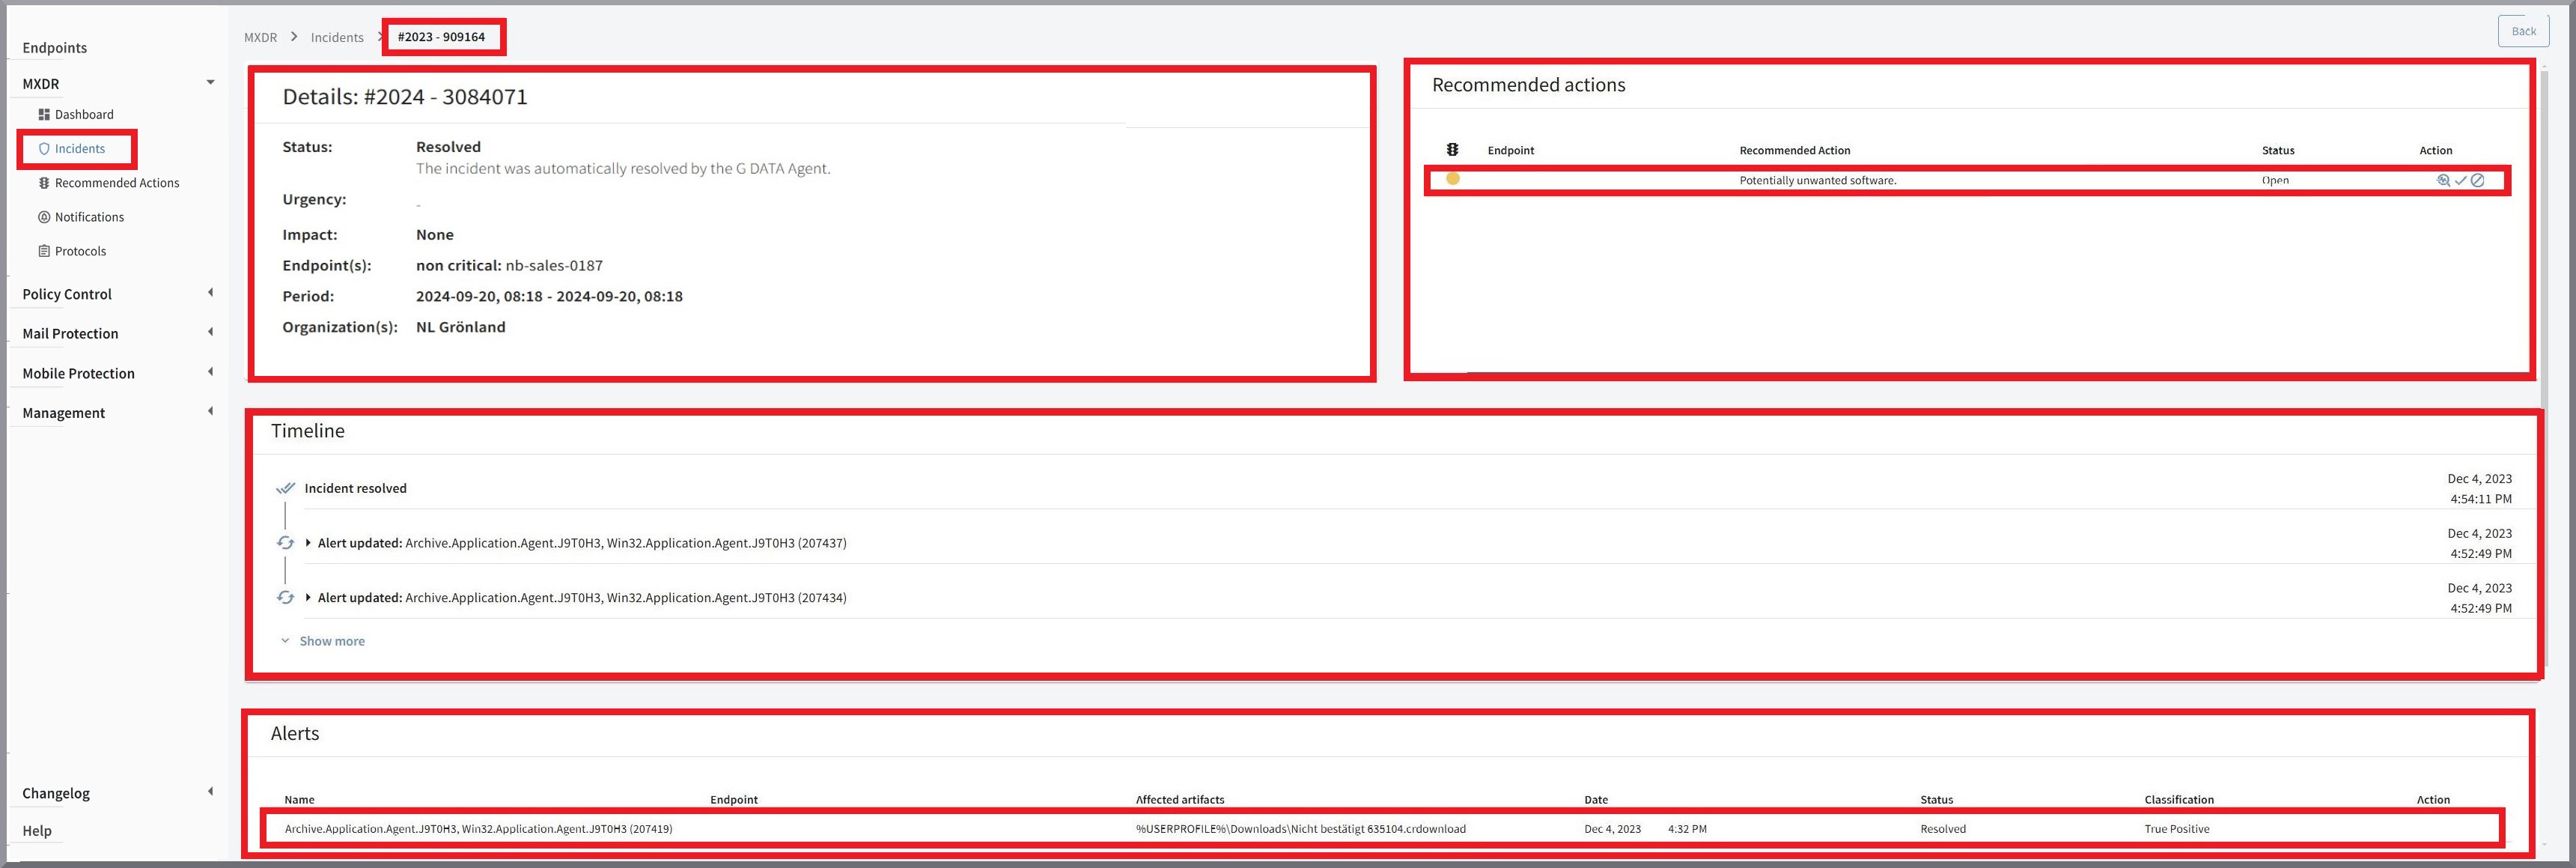
Details section
In this section, you can see at a glance the current incident Status, Urgency, and Impact, as well as the affected Endpoints. In addition, the Time period and affected Organizations are listed, and below Status there is a short description text.
| Affected endpoints are grouped into critical and non-critical. |
Relevance of Recommended Actions (→ Priority) and incidents (→ Impact)
So that important Recommended Actions immediately stand out from less important information, both incidents and Recommended Actions receive a color marker based on the assessment of their importance.
|
Regarding terminology: G DATA uses the term "Impact" for incidents and the term "Priority" for Recommended Actions. |
An incident can have the impact None, Low, Medium, High, or Severe. By default, the incident is assigned the impact Medium. In some cases, the impact is changed manually by the G DATA Security Analysten. If the impact High or Severe has been assigned, a G DATA Security Analysten may urgently be waiting for feedback or for a Recommended Action to be carried out. In this case, you will see the incident’s color marker with a red status indicator.
Recommended Actions can have the priority Low, Medium, or High and should be handled accordingly.
These different color variants are available:
|
If a green marker is present, there is nothing for you to do. In this case, G DATA was able to eliminate the threat and there are no tasks for you. |
|
If a yellow marker is present, it is necessary for you to perform an action. The action is not urgent, but it should be carried out. |
|
If a red marker is present, it is urgently necessary for you to perform an action. |
|
If a gray marker is present, G DATA is currently working on resolving the issue. After the G DATA Security Analysten have completed the process, the status changes to red, yellow, or green. |


The status of an incident
Status refers to the current processing state. Some statuses are set automatically by our cloud backend, while others are set by the G DATA Security Analysten.
New |
A new incident is present. As soon as a G DATA security analyst investigates the incident, the status is updated.
|
||
Automatically resolved |
The incident was automatically resolved by the G DATA Agent. |
||
In progress |
The incident is currently being investigated by a G DATA Security Analysten. Once the investigation is complete, the status is updated. |
||
Resolved |
The incident was resolved by a G DATA Security Analysten. If you are still shown open Recommended Actions, please carry them out. |
||
Deferred |
Work on the incident is paused. We are waiting for internal analysis results or your feedback. After that, the incident will continue to be processed. |
||
Reprocessing |
The incident is being investigated again by a G DATA Security Analysten. Once the investigation is complete, the status is updated. |
||
Action required |
Please carry out the displayed Recommended Action. |
||
Analysis in progress |
The incident is undergoing an extensive analysis. This may take some time. We will contact you if your involvement is required. |
||
Waiting for G DATA Agent |
Work on the incident is paused. We are waiting for feedback from the G DATA Agent. After that, the incident will continue to be processed. |
Recommended Actions section
In the right-hand block of the incident overview, you will see a list of all Recommended Actions associated with this incident. Recommended Actions are provided to you for an incident by our G DATA Security Analysten.
These can include:
-
simple tips and tricks to avoid incidents,
-
simple tasks to be performed (such as a reboot),
-
or complex actions that are necessary to prevent or limit damage as quickly as possible.
There are four columns in the list of Recommended Actions.
|
This shows the priority of the Recommended Action. |
||||||||
Endpoint |
The affected endpoint for the Recommended Action is listed here. |
||||||||
Recommended Action |
The name of the Recommended Action. |
||||||||
The Action column |
|


History (timeline)
This chronologically ordered overview lists all interactions associated with an incident. This can include the alerts themselves and their updates, as well as all Recommended Actions and file operations related to the incident. All entries are provided with a date and an exact timestamp and can be expanded for further details. This allows the entire incident to be traced in detail.
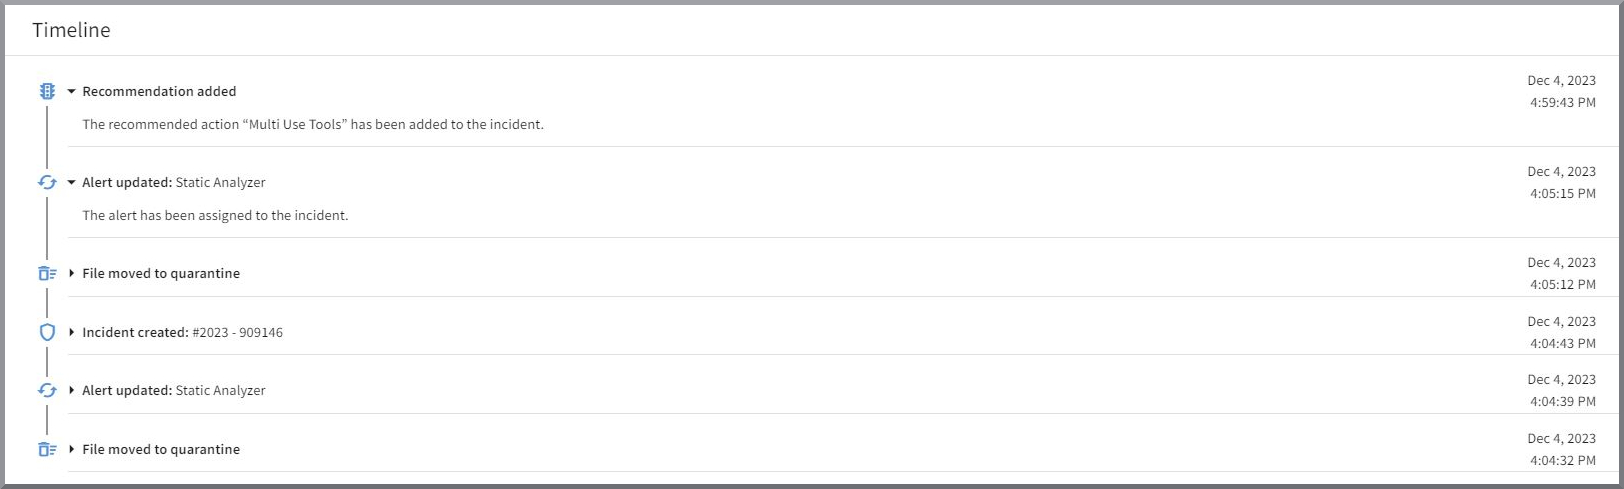
By default, the timeline shows three events and can be expanded by clicking Show more.
Alert graph
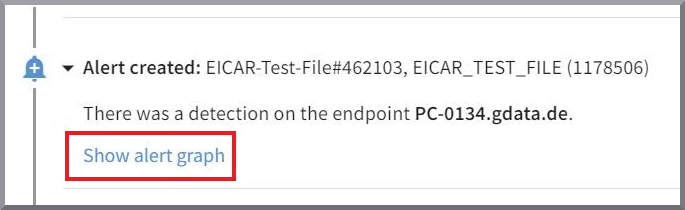
From the timeline, you can view the alert graph for the respective incident. To do so, select an entry in the timeline and then click Show alert graph. Please note that the alert graph is available only for alerts that are connected to detections and were created starting in August 2024.
You can also access the alert graph from the list of alerts by clicking the  icon.
icon.
|
Alerts section (Alerts)
In the lower block of the incident overview, you will find the list of alerts assigned to this incident.
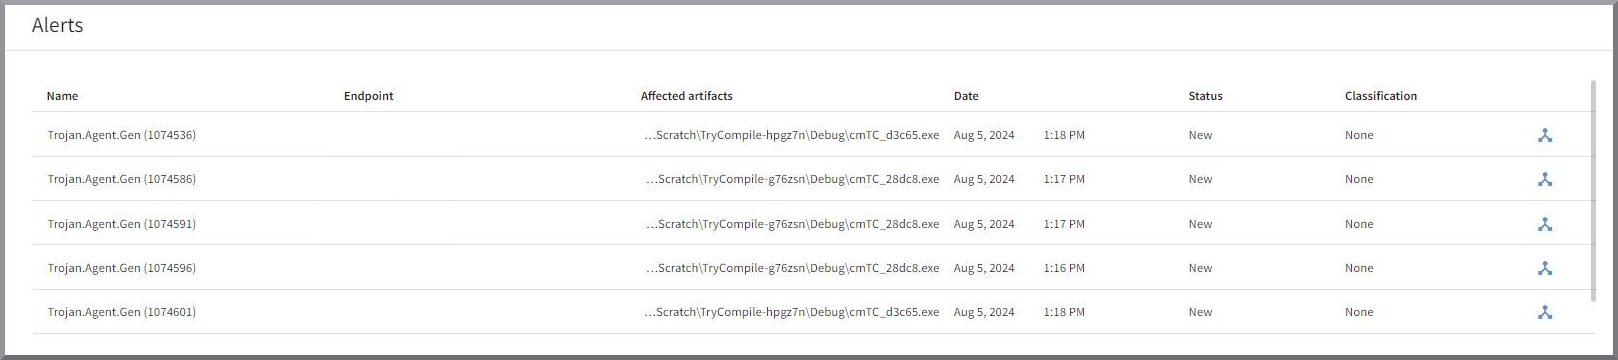
Name |
These are the names that the sensor was able to assign to this incident, for example a virus name. |
Endpoint |
This lists the endpoints on which alerts occurred. If multiple alerts occurred for one endpoint,
you will see the same endpoint in each row. |
Affected artifacts column |
Here you are shown which files or processes were affected by this incident. |
Date |
Date and time of the alert. |
Status |
Here you can see the status of the incident to which the alert belongs. |
Classification |
This column shows whether it is a legitimate alert (True Positive) or a false alarm (False Positive). |
|
|
Clicking this icon takes you directly to the alert graph associated with the alert. |
Additional alert details
Clicking an entry in the list opens a details window for the respective alert on the right.
Show screenshot
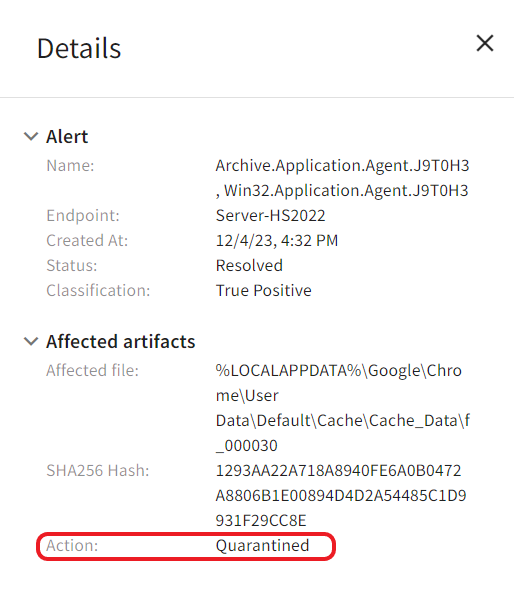
The details page shows you a summary of the most important information, such as:
-
the name transmitted by the reporting sensor,
-
when the alert occurred,
-
what status it has, and
-
how it was classified.
Under Affected artifacts, you can see which file or process the sensor of the G DATA Agent triggered on, as well as its response.
In our example (see screenshot), a file was detected and moved to quarantine.
If we were able to determine a SHA-256 hash value, it is also displayed here.