G DATA MXDR
The Alert Graph
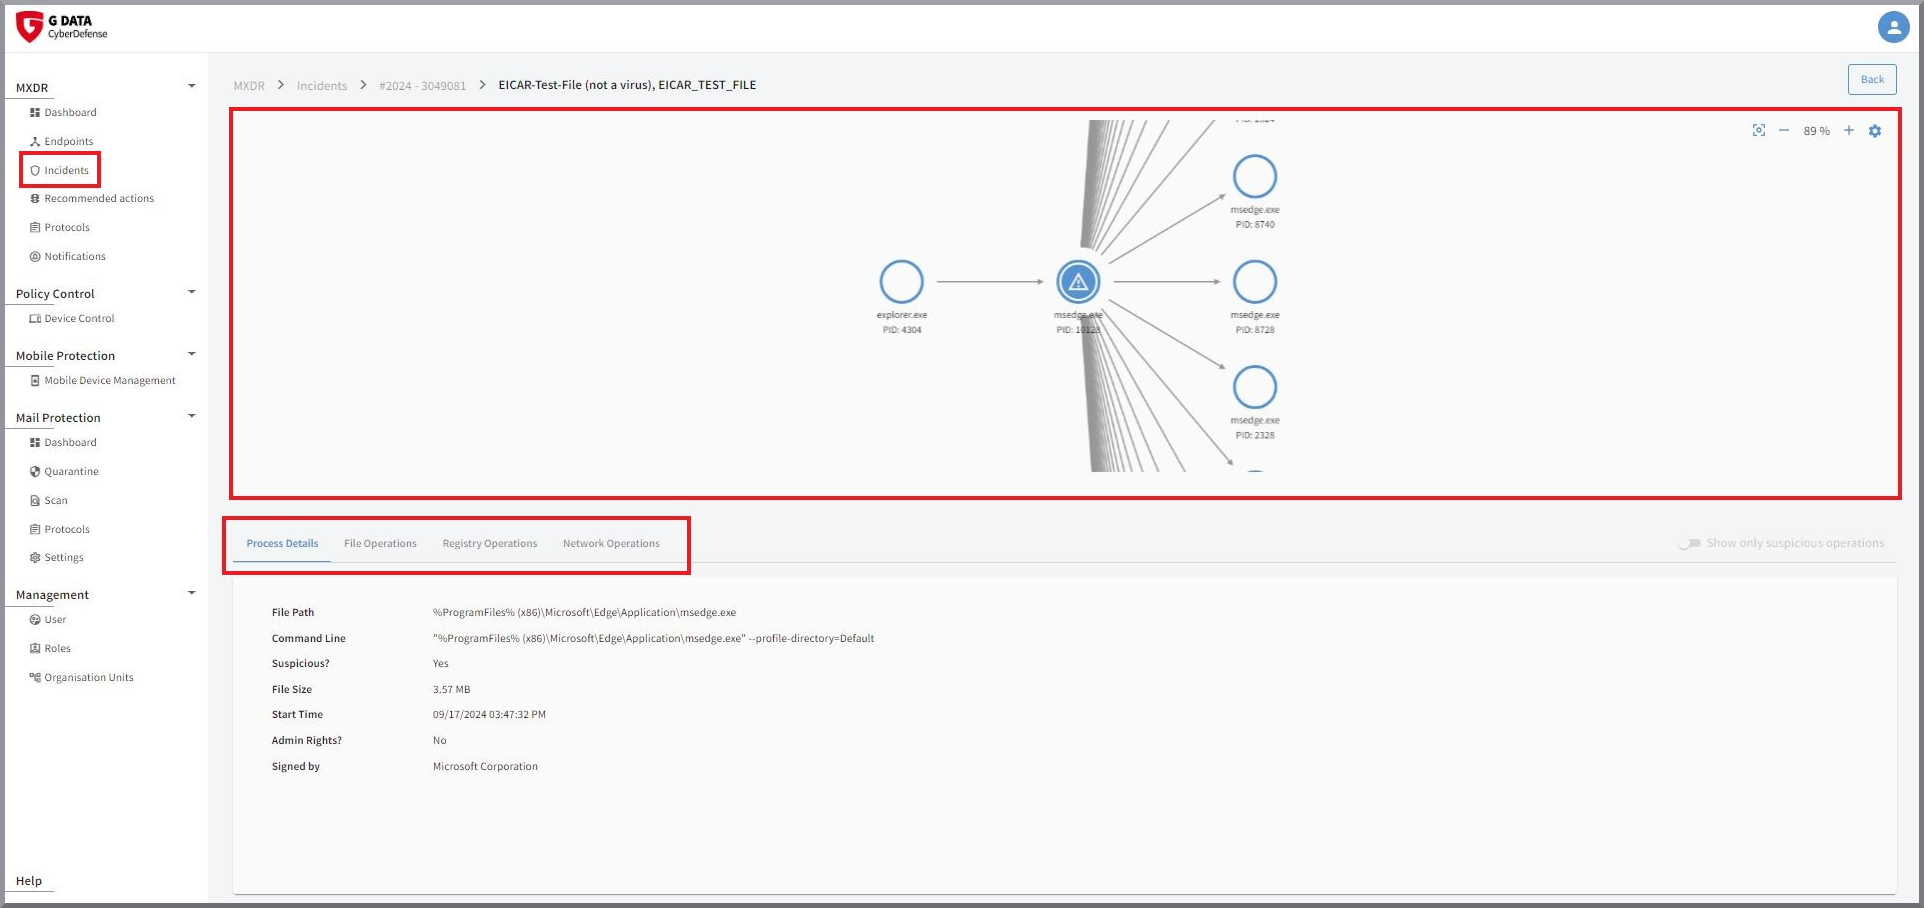
The Alert Graph helps you better understand the complex structures of the involved processes. This is a useful feature when, for example, a security incident needs to be analyzed in detail.
Here you can review all processes in detail, specifically with regard to…
-
general process details.
-
file operations.
-
operations in the Windows Registry.
-
network activities.
| The Alert Graph is currently available only for systems with a Windows operating system. |
Visualization of processes within an alert
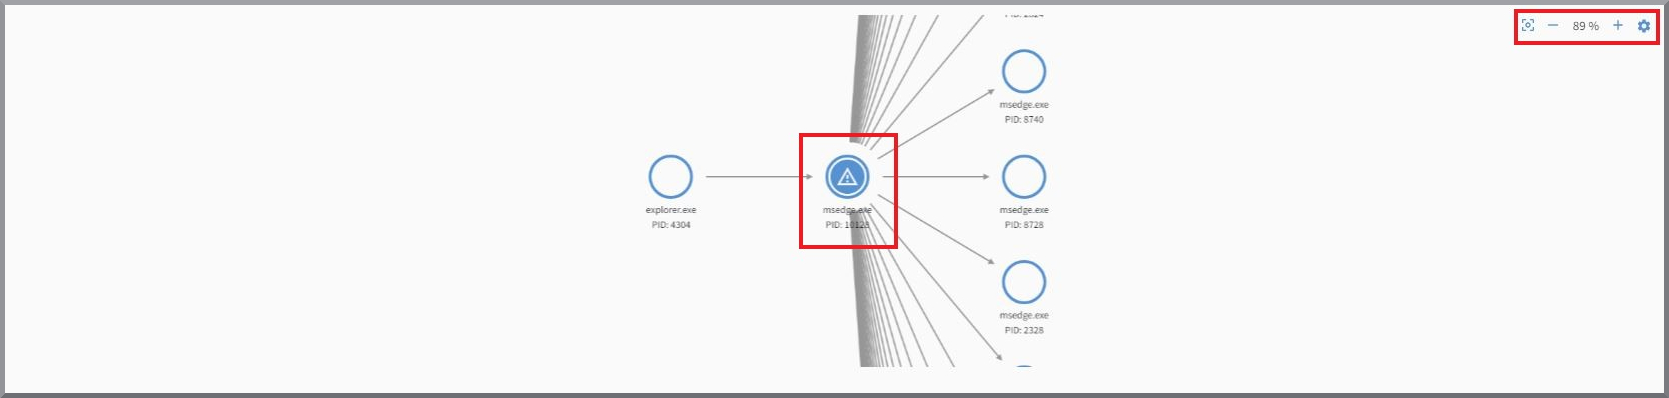
This overview is the actual Alert Graph and displays the processes that belong to the alert. In this visualized
display, you can see which processes invoked other processes and what then
occurred within them.
Which process invoked other processes, and which processes exactly?
What happened to which files on the system?
Were changes made in the Windows Registry and, if so, what exactly changed there?
Was there communication to external destinations and, if so, to where?
All of these questions can be subjected to an in-depth analysis.
The graph can contain a large number of individual processes and therefore take up a significant amount of space. You can pan the view
within the window with the left mouse button and zoom out and in within the graph using the mouse wheel. Alternatively,
you can use the buttons provided next to the current zoom level ( ).
).
To the left of the zoom level buttons is a button for resetting the viewport position
( ) to the initial view position and the original zoom level.
A process marked with a warning symbol represents the core of the Detection for the respective alert. The processes
can be selected individually and are then highlighted in blue. All detailed information displayed below the graph
refers to the process selected in the graph and highlighted in blue. By default, the Alert Graph view
is centered on the currently selected process. You can adjust this behavior by clicking the gear icon
( ).
).
| The graph refers to the processes that belong to one alert, not to the processes of all alerts that belong to an incident! |
Detailed information on the processes
-
The information on the processes is subdivided into the sections Process details, File operations, Registry operations, and Network operations.
-
Not suspicious operations provide context information about the processes; suspicious operations have direct connections to the Detection.
-
The "Show only suspicious operations" button displays only suspicious entries in the File operations and Registry operations sections.
| The entries within the sections can be sorted alphanumerically in ascending or descending order by left-clicking the column name. |
|
Some information is displayed in abbreviated form for improved readability. The full information can always be viewed via mouseover and copied out if required. 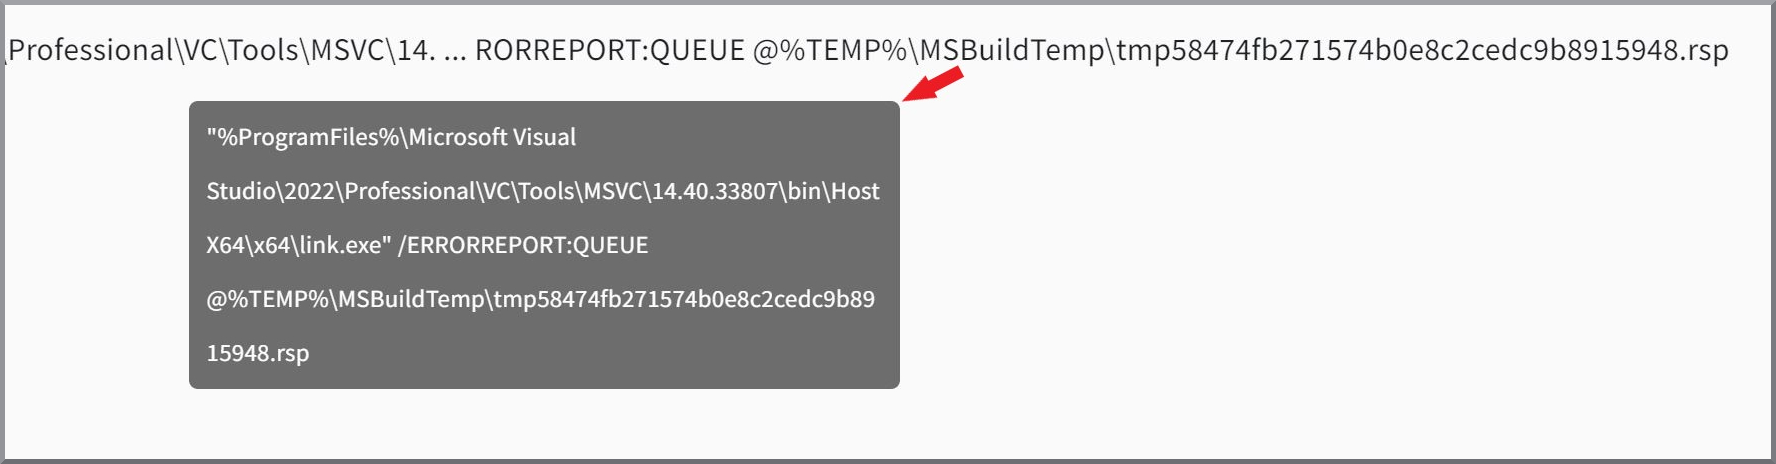
|
Process details
General information about the process is listed here.
This includes…
-
the file location on the system.
-
the exact command line, including all arguments.
-
the file size.
-
the process start time.
-
whether execution was performed with admin privileges.
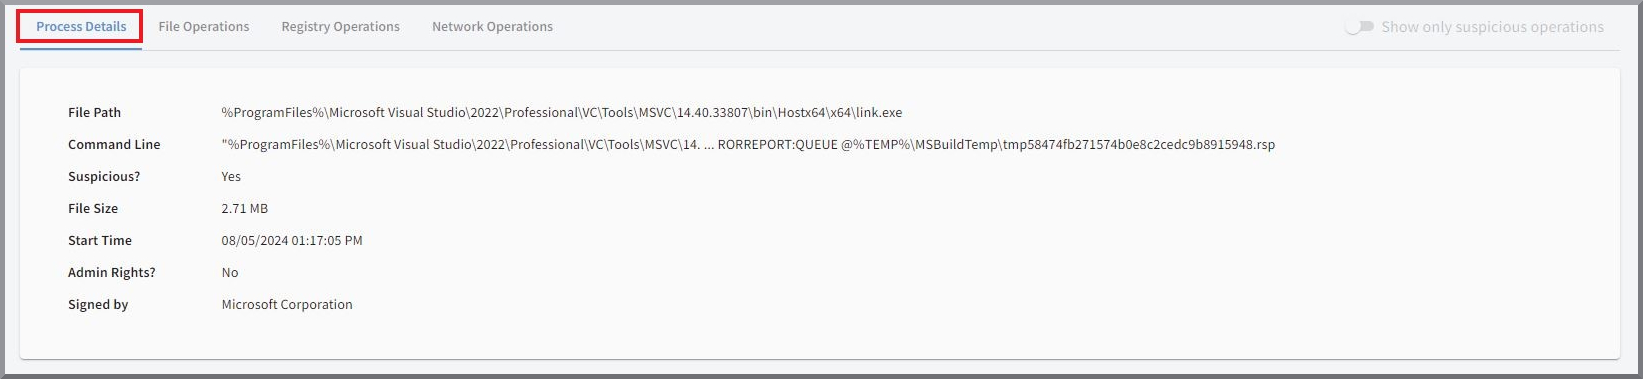
The "Suspicious?" field indicates whether the overall process has been classified as suspicious by the Agent.
File operations
All file operations related to the respective process are listed here. The information listed includes file path, Created, and type of operation.
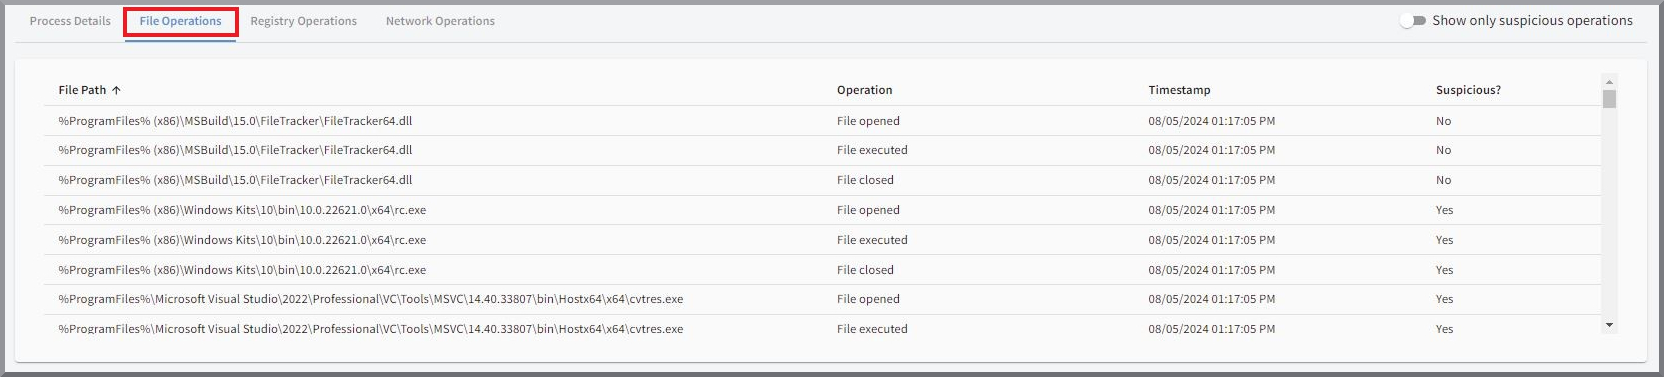
File path |
Path of the file on the system to which the operation refers. |
Operation |
Exact type of file operation. The options are…
|
Created |
Exact time at which the operation was started. |
Suspicious? |
Indicates whether this is an operation that played a role in the Detection. |
Registry operations
Information about changes in the Windows Registry that were initiated by the process is displayed. This includes all information relating to the key itself, as well as Created and type of operation.
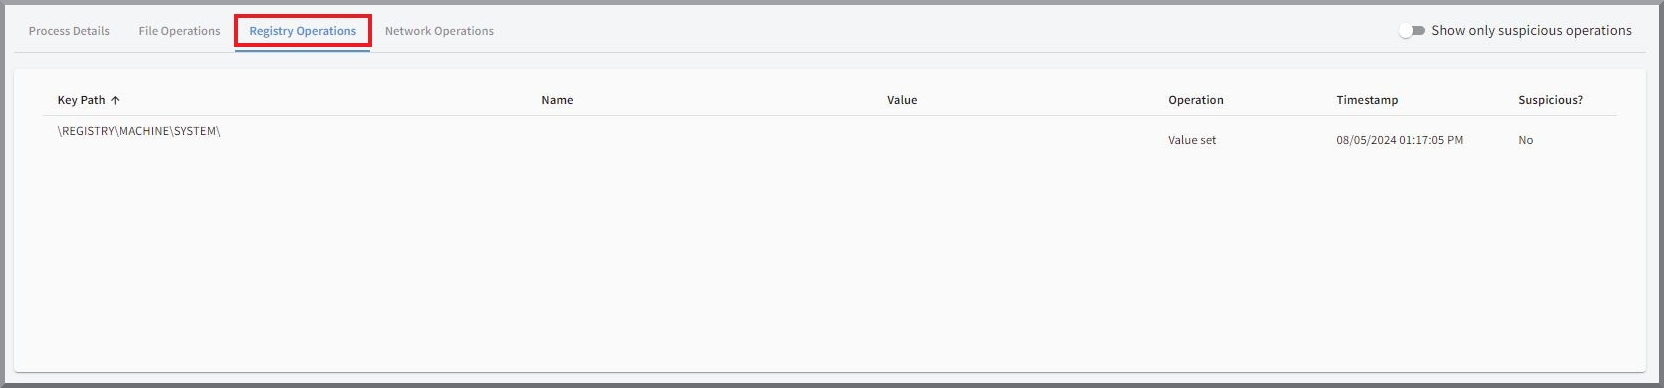
Key path |
Path of the key within the Windows Registry to which the operation refers. |
Name |
Name of the value within the key in the Registry to which the operation refers. |
Value |
Value after the operation, if present. |
Operation |
Type of operation. The options are:
|
Created |
Exact time of the operation. |
Suspicious? |
Indicates whether this is an operation that played a role in the Detection. |
Network operations
If present, all operations triggered by the process within the network are listed here. In addition to Created and type of operation, this also includes all relevant connection details.
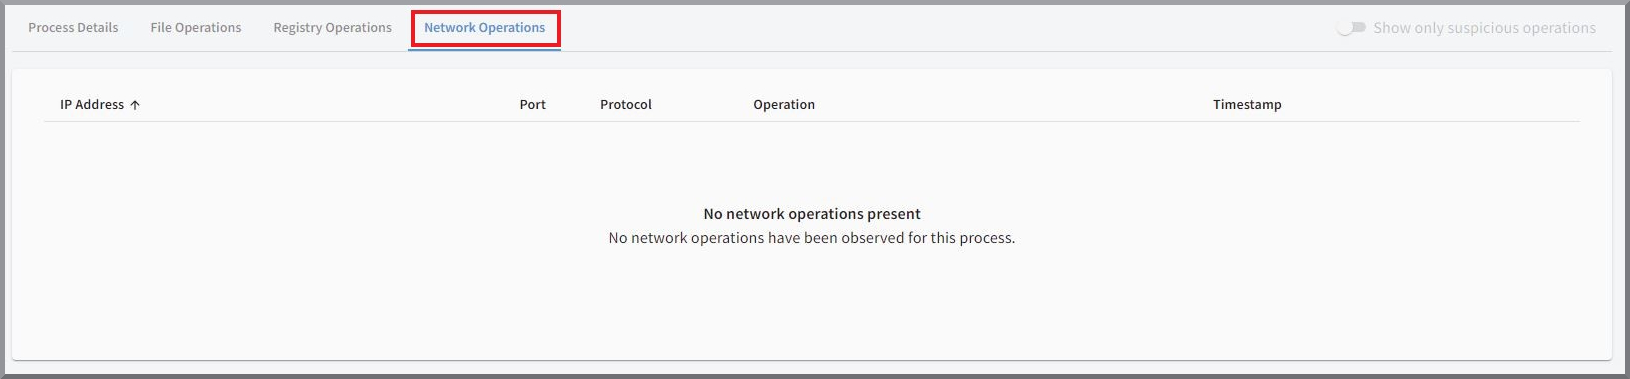
IP address |
For the "Connection established" operation, the IP address to which the connection was established. If the "Opened for inbound connections" operation is present, your own IP address is displayed here. |
Port |
Port that was used for the connection. |
Protocol |
Protocol that was used for the connection. Options are TCP or UDP. |
Operation |
Type of network operations. The options are:
|
Created |
Exact time of the network operations. |