G DATA XDR
The alert details page
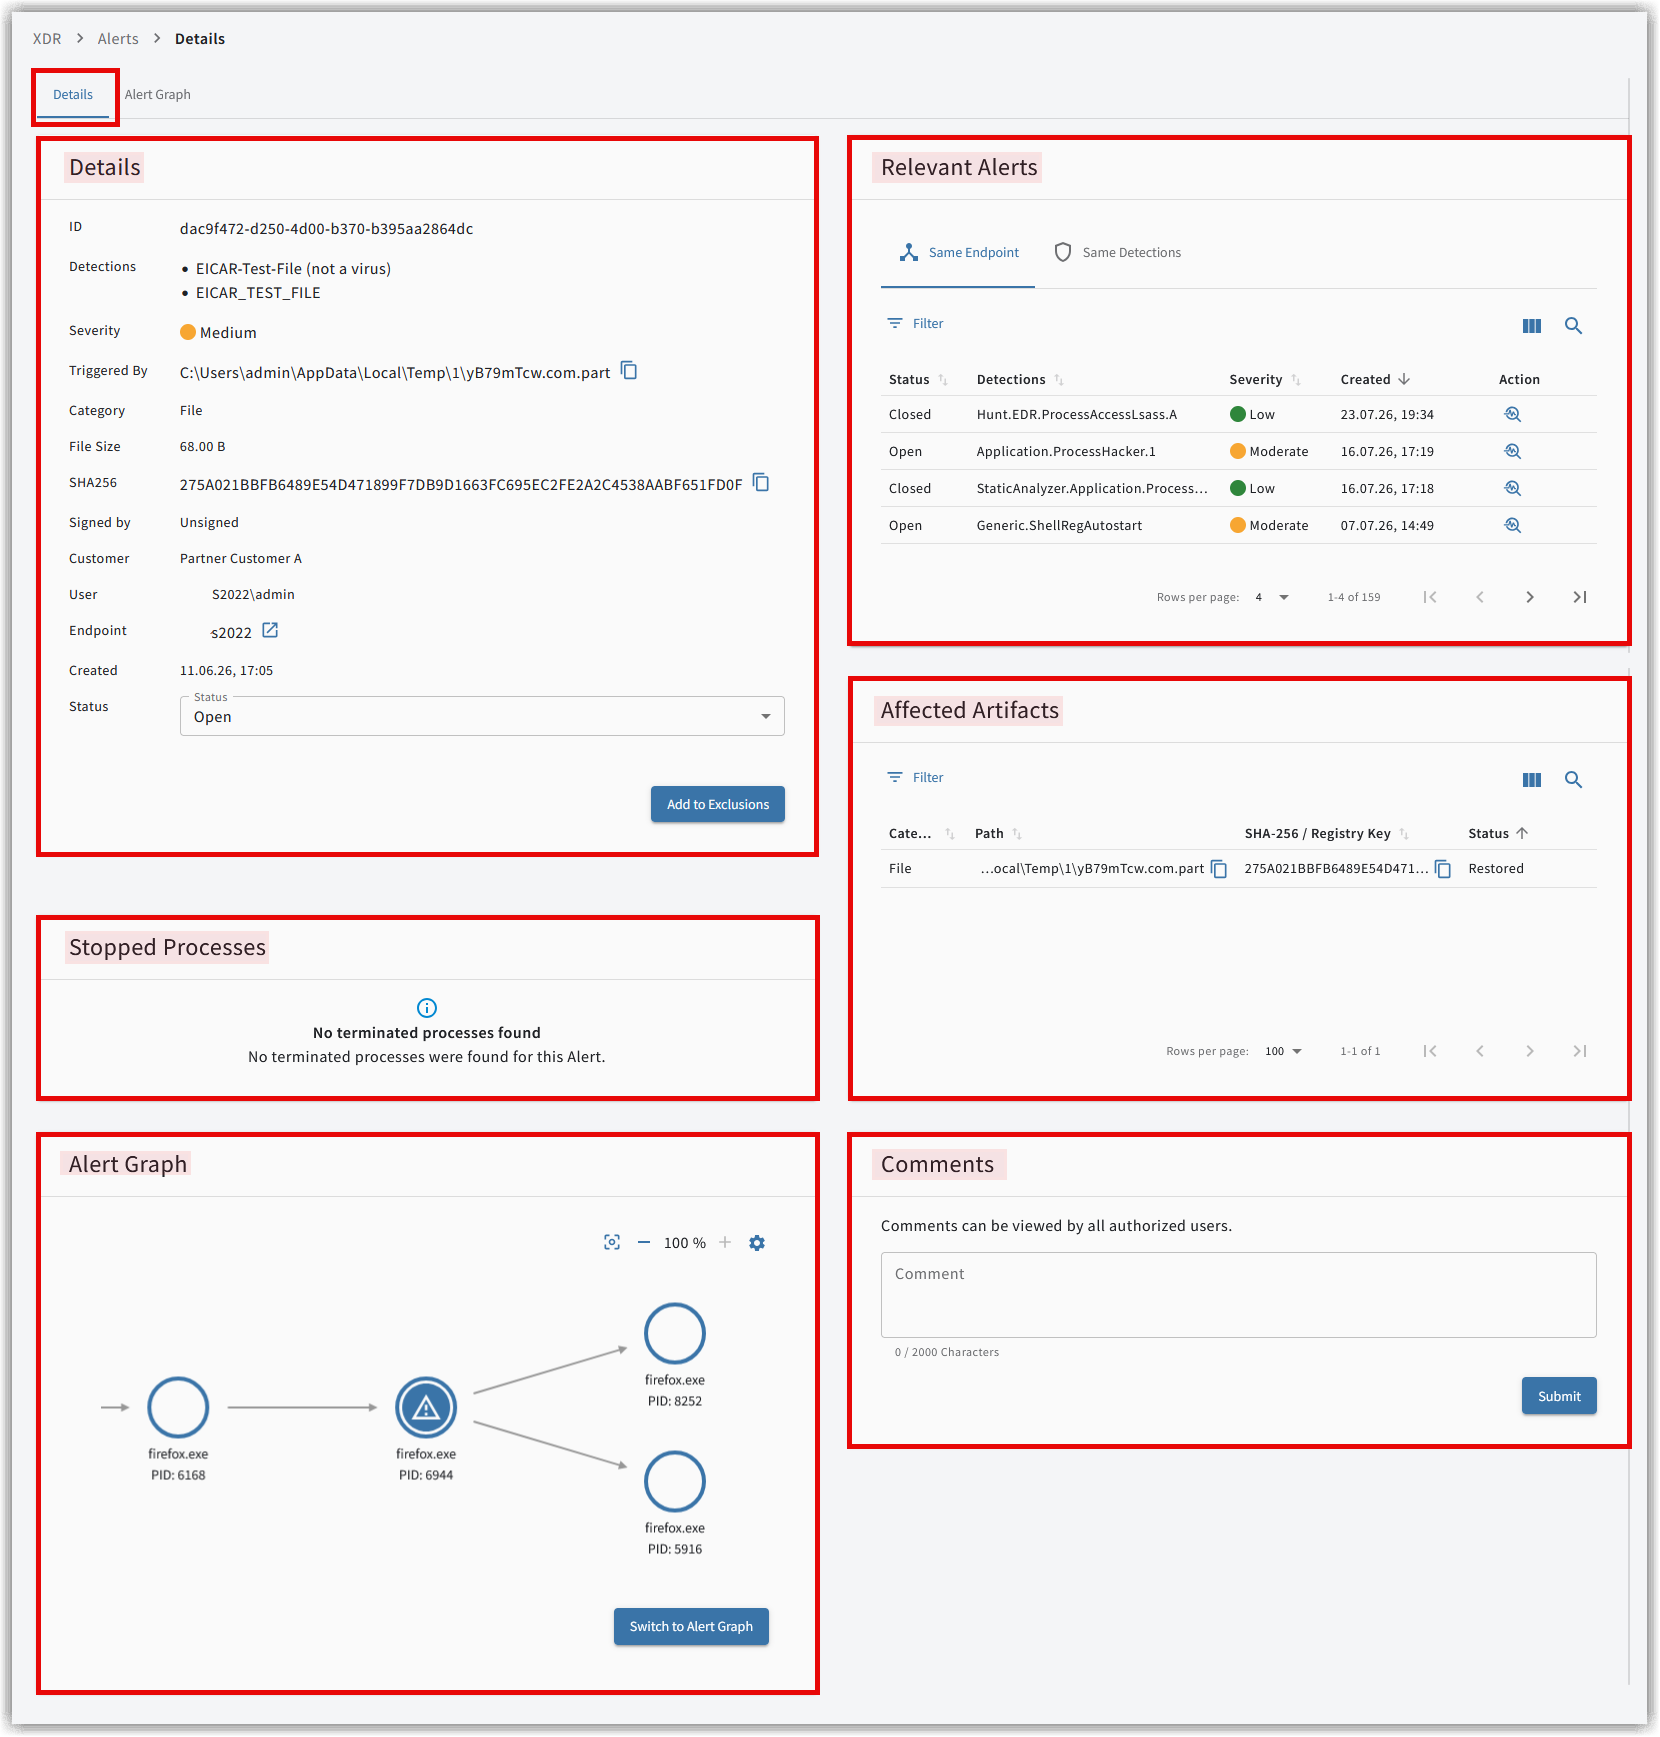
A key part of operating G DATA XDR is the continuous monitoring of the alerts displayed in the G DATA Web Portal.
These must be reviewed regularly, assessed, and addressed promptly. The user independently decides whether
further measures or action are necessary.
To be able to make an evidence-based decision, this page provides you with all important information at a glance.
The details page is divided into two tabs: the Details tab and the Alert graph tab.
The Details tab
Under the Details tab, you will find various tiles that provide an overall view of the security event.
The Details tile
In the details tile, you can see the most important information. This differs depending on whether it is an alert for a file or for a process.
The alert refers to the file type.
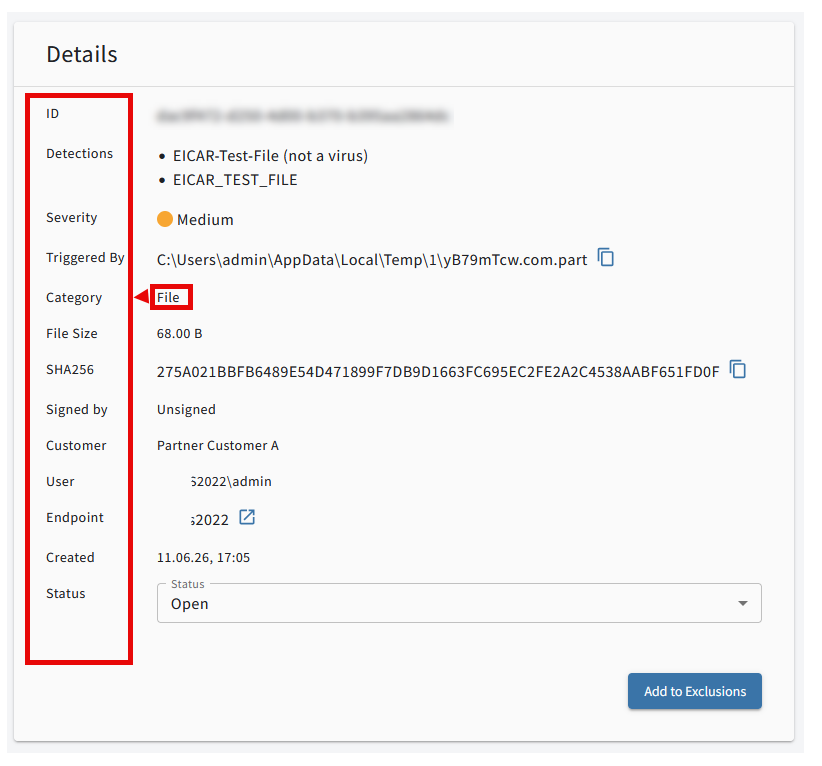
ID |
Unique ID of the alert. Assigned when the alert is created. |
||
Detections |
Name (label) of the alert. |
||
MITRE tactics |
Detected tactics for the detections.Such tactics can be, for example:
This field may be missing if no tactic was detected. |
||
Severity |
Severity of the alert (Low, Moderate, High). |
||
Triggered by |
Path to the detected file. |
||
Type |
File or process. |
||
File size |
Size of the file. |
||
SHA256 |
|||
Signed by |
Party that signed the file. If the file is not signed, the field contains Not signed.
|
||
Customer |
The name of the customer where the endpoint is located (partner feature) |
||
User |
User in whose session the detection was triggered.
|
||
Endpoint |
Endpoint on which the detection was triggered. |
||
Created |
Time when the detection was triggered, based on the endpoint’s system time. |
The alert refers to the process type.
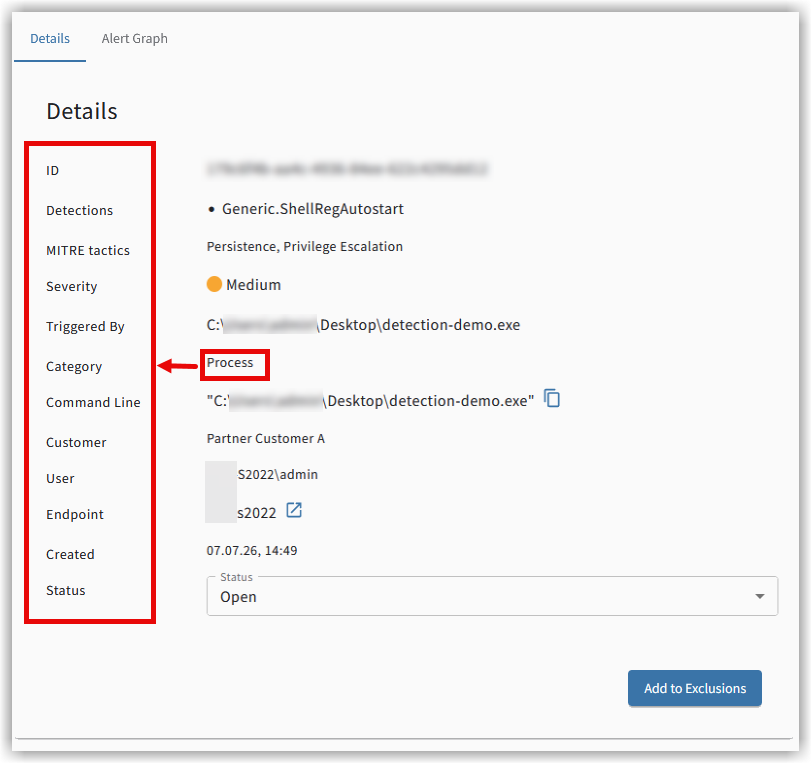
ID |
Unique ID of the alert. Assigned when the alert is created. |
||
Detections |
Name (label) of the alert. |
||
MITRE tactics |
Detected tactics for the detections.Such tactics can be, for example:
This field may be missing if no tactic was detected. |
||
Severity |
Severity of the alert (Low, Moderate, High). |
||
Triggered by |
Path to the file that started the detected process. |
||
Type |
File or process. |
||
Command line |
Command used to start the detected process. |
||
Customer |
The name of the customer where the endpoint is located (partner feature) |
||
User |
User in whose session the detection was triggered.
|
||
Endpoint |
Endpoint on which the detection was triggered. |
||
Created |
Time when the detection was triggered, based on the endpoint’s system time. |
The action button in the details tile
In the lower-right corner of the details tile, there is an action button that you can use to either …
-
set an Exclusion
 .
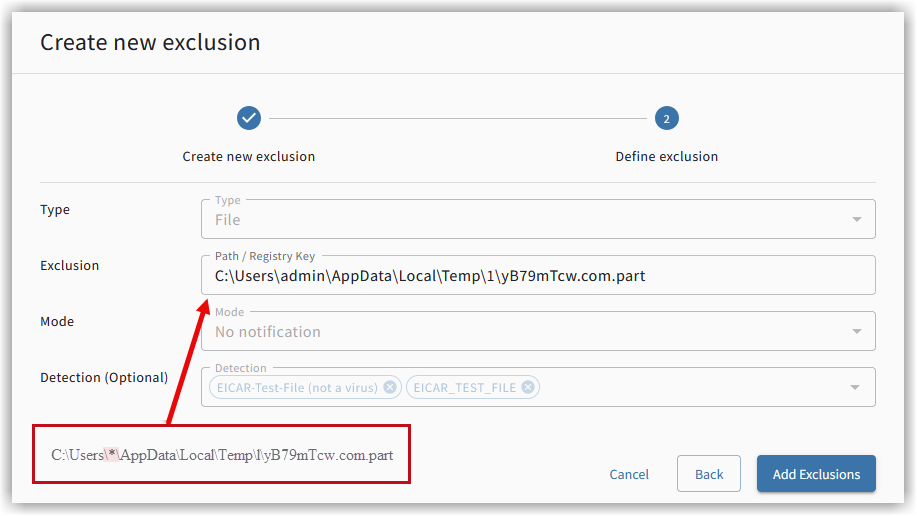
.When you use this button, you access the same function that you can use to manually create the Exclusion.
The difference is that the required information is already defined. At this point, it is possible to expand the scope of the Exclusion and to increase the scope using placeholders.
For example, you can expand a file in the user directory of the user admin to all users with this directory:
-
restore artifacts from Quarantine
-
delete artifacts from Quarantine
 .
.
Click  and select which button you want to use.
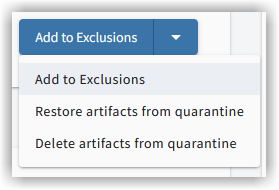
The corresponding button is displayed. Click the button to open the corresponding function.
| If no artifact is present, or if the artifact in Quarantine has already been restored or deleted, selecting the action button is no longer possible. An Exclusion can still be created. |
The Status tile
The selection menu for changing the status of the alert is also located in the details tile.
The following status values are possible:
-
Open
-
Closed
-
False positive
-
Reopened
Setting a status has no technical impact. The status is used to label an alert. This labeling
makes it easier to categorize and filter alerts. Processed alerts are closed
so that they are no longer displayed in the overview. However, if you search for them specifically, the alerts are
still available.
This allows you to review past events again if needed. If you set an alert to
False positive, you can keep track of which alerts did not report a real security incident.
This is helpful if you want to set or delete Exclusions.
|
Never treat an alert as a false positive and do not set the corresponding Exclusion unless you are
sure that it is actually a false positive alert. Setting Exclusions based on an assumption represents a high security risk. For customers who need help from an experienced SecOperations team, G DATA offers the product G DATA MXDR . |
Relevant alerts
Here you can view all other alerts related to the accessed alert. Alerts are displayed
-
that were reported on the endpoint earlier or at the same time.
-
that occurred with the same event on other endpoints.
|
The following columns are displayed:
|
|
The following columns are displayed:
|
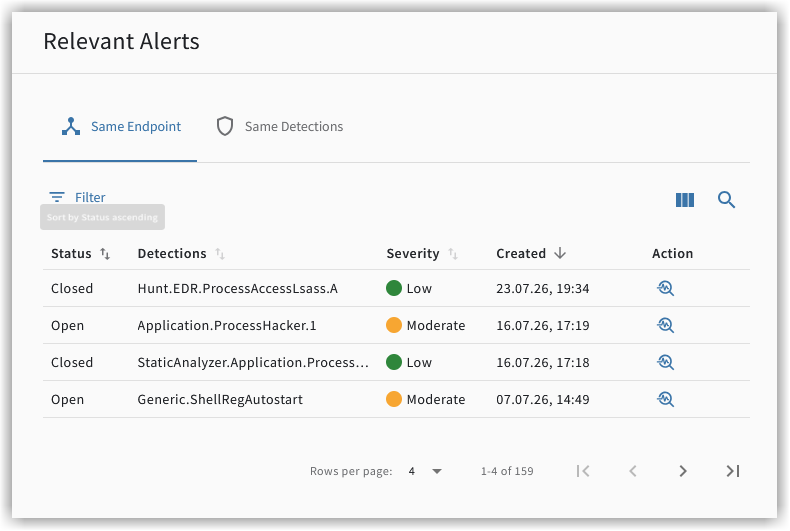
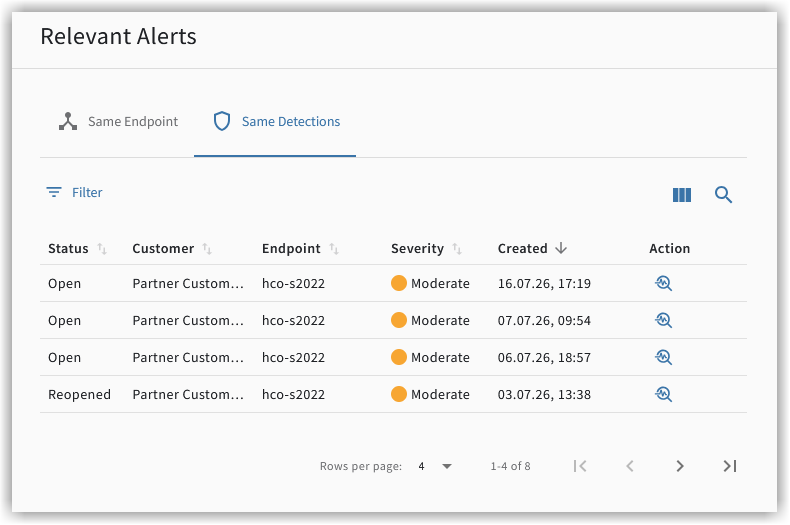
Using the action button ( ) behind an alert in this tile, you can switch
to the respective alert.
) behind an alert in this tile, you can switch
to the respective alert.
With this function, you can link information that may provide indications of a company-wide outbreak of an infection. If the same infection occurs repeatedly on a computer, it is very likely that the source of the infection has not yet been found and eliminated.
| For customers who need help from an experienced SecOperations team, G DATA offers the product G DATA MXDR . |
The Stopped processes tile
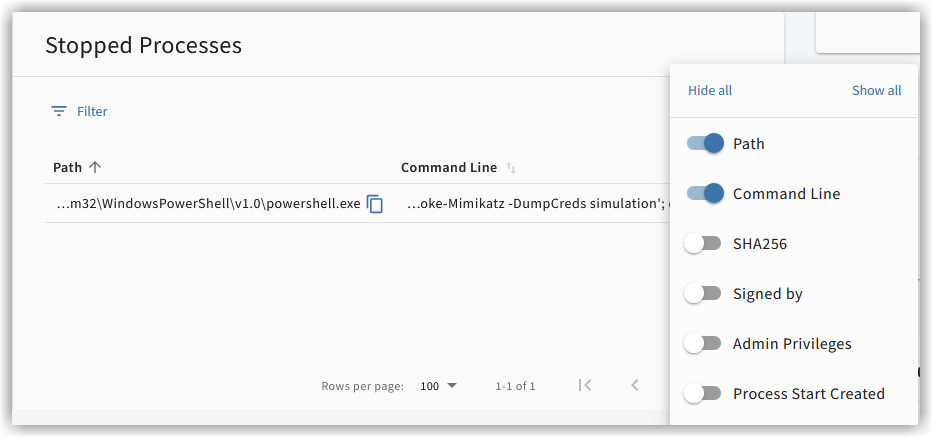
If the G DATA Agent has stopped one or more processes during an event, they are listed in this tile.
By default, you first see the Path and Command line columns. This information is also included in the details tile.
You can show or hide any additional columns you want to see using the columns icon  .
.
The following additional columns are available:
-
SHA256
-
Signed by
Party that signed the file. If the file is not signed, the field contains Not signed.
Executable files should always be signed. Do not run unsigned files, especially if G DATA XDR has already been triggered by them.
Exercise particular caution with these file types:
.sys, .cat, .msi, .exe, .dll, .ocx, .ps1.Only a valid signature guarantees that the manufacturer is known and that the file has not been tampered with.
-
Administrative privileges
Indicates whether the process was run with administrative privileges. -
Process start time
Indicates when the process was started.
The Affected artifacts tile
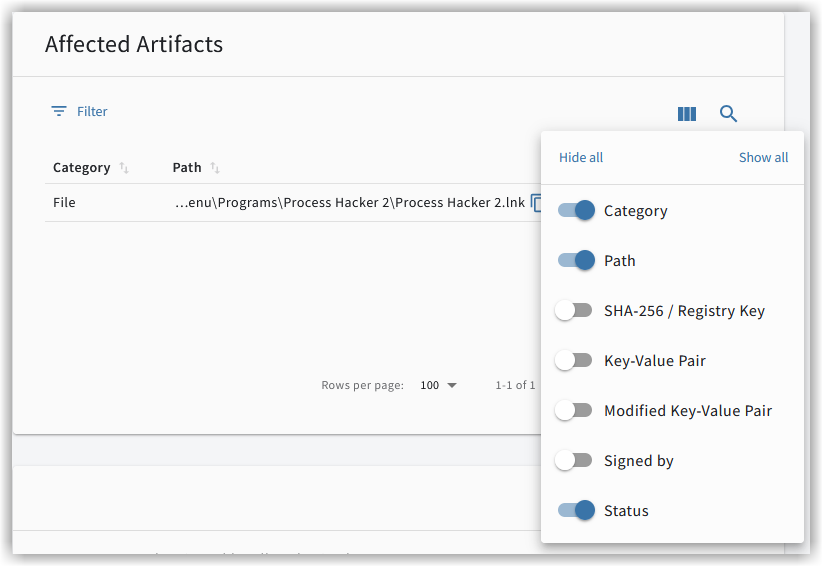
In this tile, the artifacts affected by this alert are listed.
By default, you first see the Type, Path, SHA256/Key, and Status columns. The information from Type, Path, and SHA256/Key is also included in the details tile.
You can show or hide any additional columns you want to see using the columns icon .
The following columns are available:
-
Type
File or process -
Path
Path to a file or a registry key. -
SHA256/Key
SHA256 value for a file, path to a key for a registry entry. -
Key value
If it is a file, this column is empty.
For registry entries, you see here the value of the key entered in the SHA256/Key column. -
Modified key value
The change that was prevented by the G DATA Agenten.Example of how the SHA256/Key, Key value, and Modified key value values are populated for an event:
In this example, there is a registry entry as follows:
- Path: HKEY_LOCAL_MACHINE\SOFTWARE\Microsoft\Windows\CurrentVersion\Run\
- Registry key: MyProgram
- Key value: C:\Programs\MyProgram.exeAn attacker then attempts to change the key value to the following value in order to start their own infected file:
- Key value: C:\Users\admin\Downloads\?malware.exeThis would change the path of a program that would normally be permitted at system startup to an executable file that presumably originates from an attacker.
Our Agent prevents this and moves this registry operation to Quarantine.
The corresponding artifact is then:-
Path: HKEY_LOCAL_MACHINE\SOFTWARE\Microsoft\Windows\CurrentVersion\Run
-
Key: MyProgram
-
Key value: C:\Programs\MyProgram.exe
-
Modified key value: C:\Users\admin\Downloads\malware.exe
-
-
Signed by
Party that signed the file. If the file is not signed, the field contains Not signed. -
Status
-
the status of the alert.
-
In Quarantine
-
Being restored
-
Restored
-
Being deleted
-
Deleted
-
Delete failed
-
Restore failed
If it was not possible to restore an artifact, the artifact is stored unencrypted in the following directory on the endpoint:
-
on Microsoft Windows endpoints: C:\ProgramData\G DATA\Agent\quarantine\storage.
-
on Linux and Mac endpoints: /var/lib/gdata/agent/quarantine/recovery.
Remember that after it has been restored, a file will be detected again by the G DATA Agenten if
-
it is a resolved false detection.
-
-
-
the customer for which the detection occurred (G DATA partner feature).
-
the name of the endpoint on which the detection occurred.
-
the original path and the name of the artifact that was moved to Quarantine.
-
the name of the detection due to which the artifact was moved to Quarantine.
-
the created time of the detection.
-
an action bar for editing the artifact (details page, restore, delete artifact).
The Comments tile
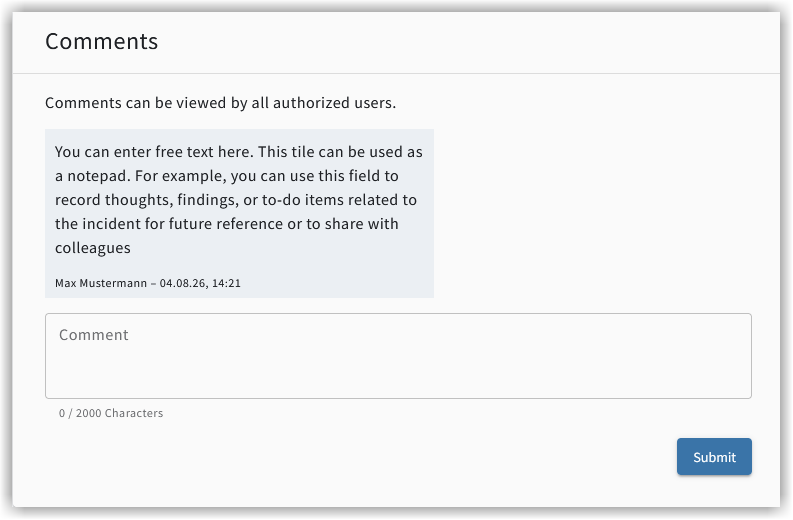
Here you can enter free text.
At this point, you can note any considerations, insights, or documentation regarding this incident that you want to keep for a later time or for your colleagues.
The Alert graph tile
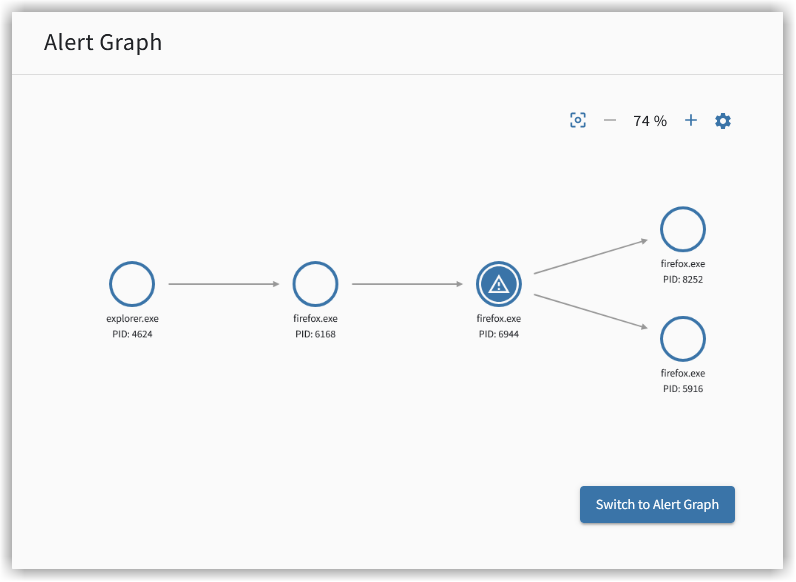
This tile provides you with a quick overview of the affected processes.
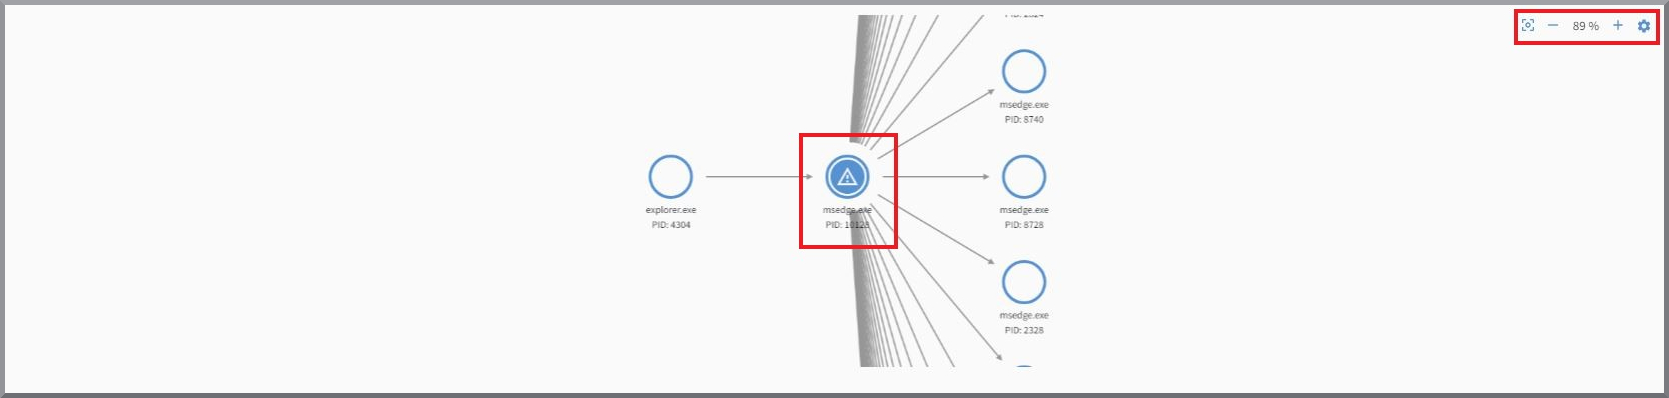
This overview is the actual Alert Graph and displays the processes that belong to the alert. In this visualized
display, you can see which processes invoked other processes and what then
occurred within them.
Which process invoked other processes, and which processes exactly?
What happened to which files on the system?
Were changes made in the Windows Registry and, if so, what exactly changed there?
Was there communication to external destinations and, if so, to where?
All of these questions can be subjected to an in-depth analysis.
The graph can contain a large number of individual processes and therefore take up a significant amount of space. You can pan the view
within the window with the left mouse button and zoom out and in within the graph using the mouse wheel. Alternatively,
you can use the buttons provided next to the current zoom level ( ).
).
To the left of the zoom level buttons is a button for resetting the viewport position
( ) to the initial view position and the original zoom level.
A process marked with a warning symbol represents the core of the Detection for the respective alert. The processes
can be selected individually and are then highlighted in blue. All detailed information displayed below the graph
refers to the process selected in the graph and highlighted in blue. By default, the Alert Graph view
is centered on the currently selected process. You can adjust this behavior by clicking the gear icon
( ).
).
| The graph refers to the processes that belong to one alert, not to the processes of all alerts that belong to an incident! |
Using the button  , you can switch to the
Alert graph tab. There you will find additional information.
, you can switch to the
Alert graph tab. There you will find additional information.
The Alert graph tab
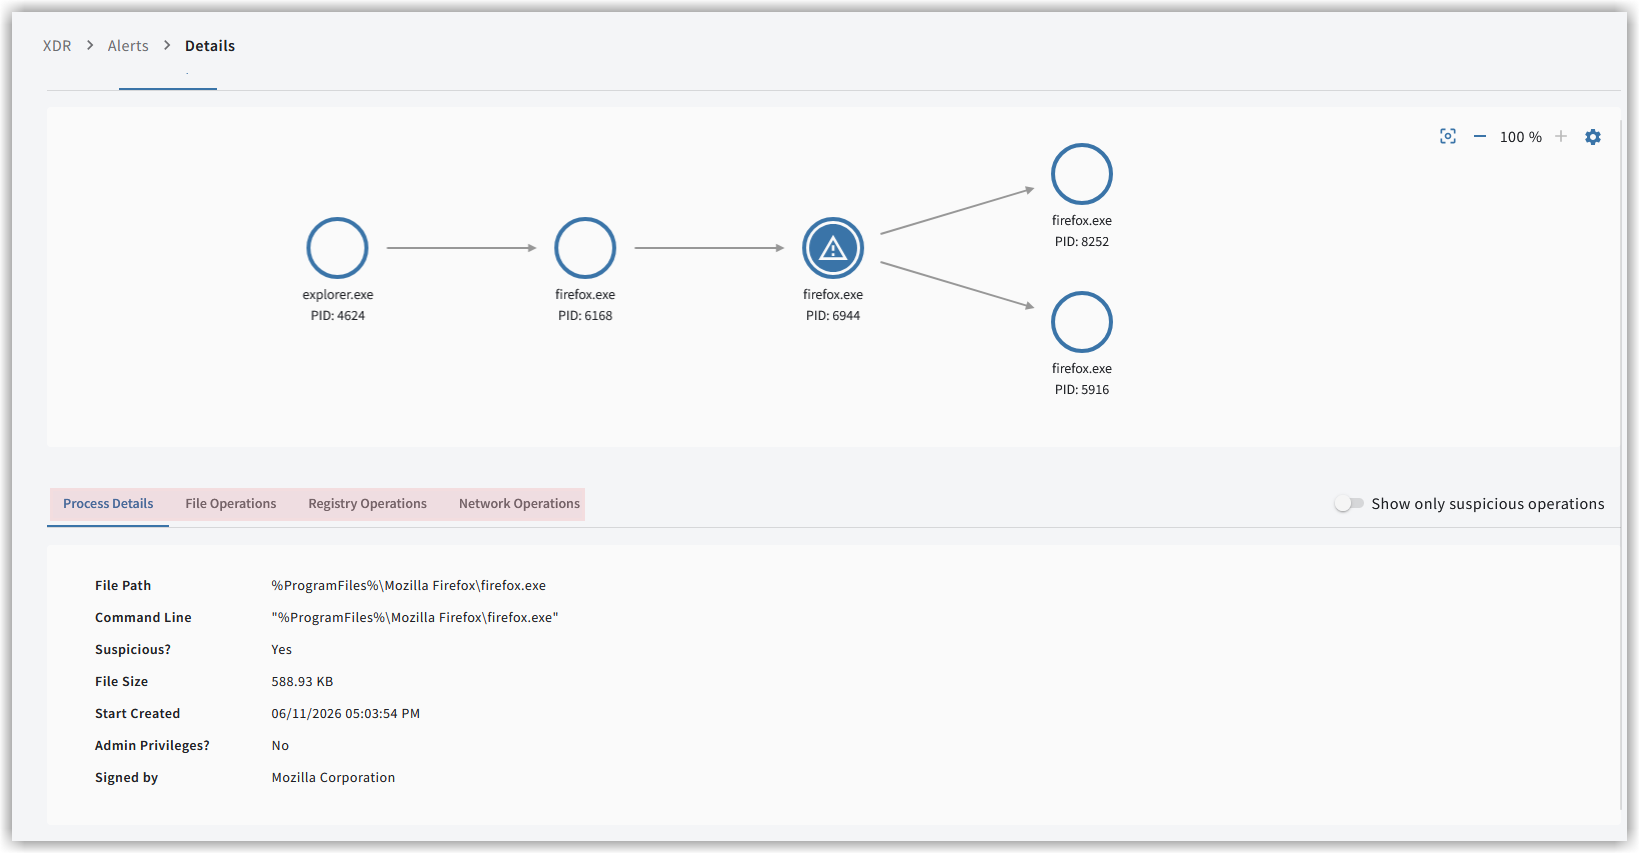
The Alert Graph helps you better understand the complex structures of the involved processes. This is a useful feature when, for example, a security incident needs to be analyzed in detail.
Here you can review all processes in detail, specifically with regard to…
-
general process details.
-
file operations.
-
operations in the Windows Registry.
-
network activities.
| The Alert Graph is currently available only for systems with a Windows operating system. |
Visualization of an Alert’s processes
This overview is the actual Alert Graph and displays the processes that belong to the alert. In this visualized
display, you can see which processes invoked other processes and what then
occurred within them.
Which process invoked other processes, and which processes exactly?
What happened to which files on the system?
Were changes made in the Windows Registry and, if so, what exactly changed there?
Was there communication to external destinations and, if so, to where?
All of these questions can be subjected to an in-depth analysis.
The graph can contain a large number of individual processes and therefore take up a significant amount of space. You can pan the view
within the window with the left mouse button and zoom out and in within the graph using the mouse wheel. Alternatively,
you can use the buttons provided next to the current zoom level ().
To the left of the zoom level buttons is a button for resetting the viewport position
() to the initial view position and the original zoom level.
A process marked with a warning symbol represents the core of the Detection for the respective alert. The processes
can be selected individually and are then highlighted in blue. All detailed information displayed below the graph
refers to the process selected in the graph and highlighted in blue. By default, the Alert Graph view
is centered on the currently selected process. You can adjust this behavior by clicking the gear icon
().
| The graph refers to the processes that belong to one alert, not to the processes of all alerts that belong to an incident! |
Detailed information about the processes
-
The information on the processes is subdivided into the sections Process details, File operations, Registry operations, and Network operations.
-
Not suspicious operations provide context information about the processes; suspicious operations have direct connections to the Detection.
-
The "Show only suspicious operations" button displays only suspicious entries in the File operations and Registry operations sections.
| The entries within the sections can be sorted alphanumerically in ascending or descending order by left-clicking the column name. |
|
Some information is displayed in abbreviated form for improved readability. The full information can always be viewed via mouseover and copied out if required. 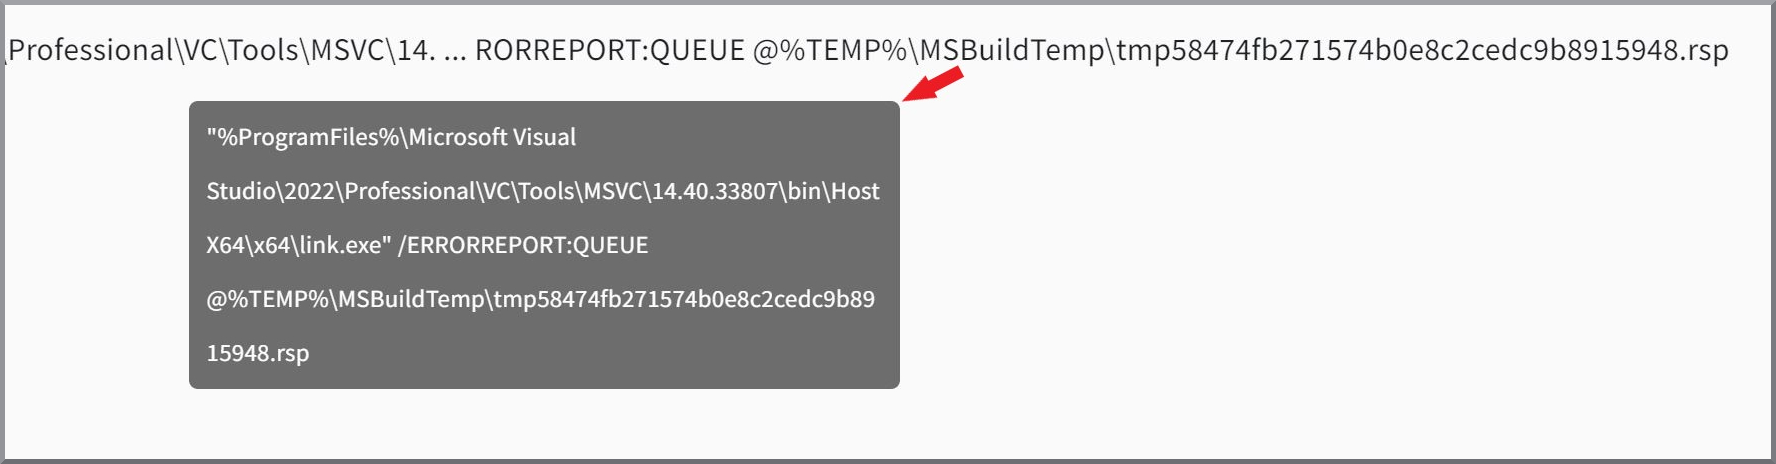
|
Process details
General information about the process is listed here.
This includes…
-
the file location on the system.
-
the exact command line, including all arguments.
-
the file size.
-
the process start time.
-
whether execution was performed with admin privileges.
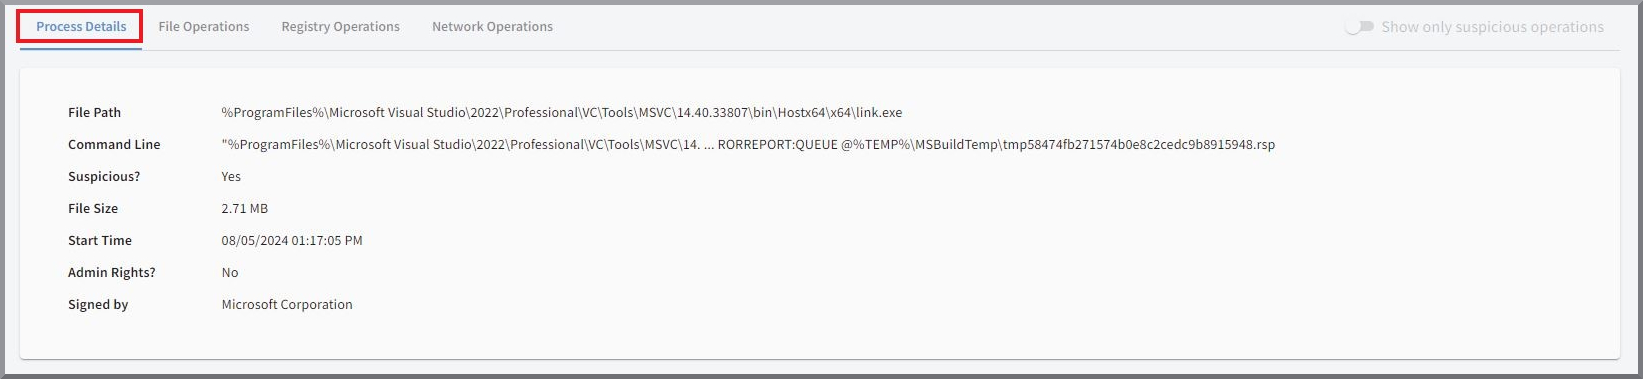
The "Suspicious?" field indicates whether the overall process has been classified as suspicious by the Agent.
File operations
All file operations related to the respective process are listed here. The information listed includes file path, Created, and type of operation.
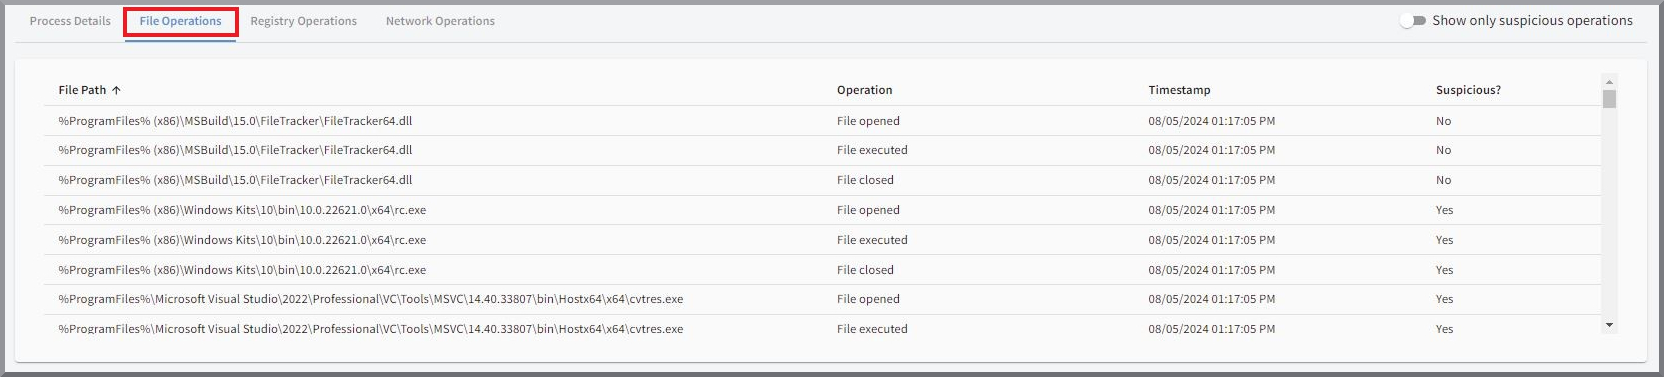
File path |
Path of the file on the system to which the operation refers. |
Operation |
Exact type of file operation. The options are…
|
Created |
Exact time at which the operation was started. |
Suspicious? |
Indicates whether this is an operation that played a role in the Detection. |
Registry operations
Information about changes in the Windows Registry that were initiated by the process is displayed. This includes all information relating to the key itself, as well as Created and type of operation.
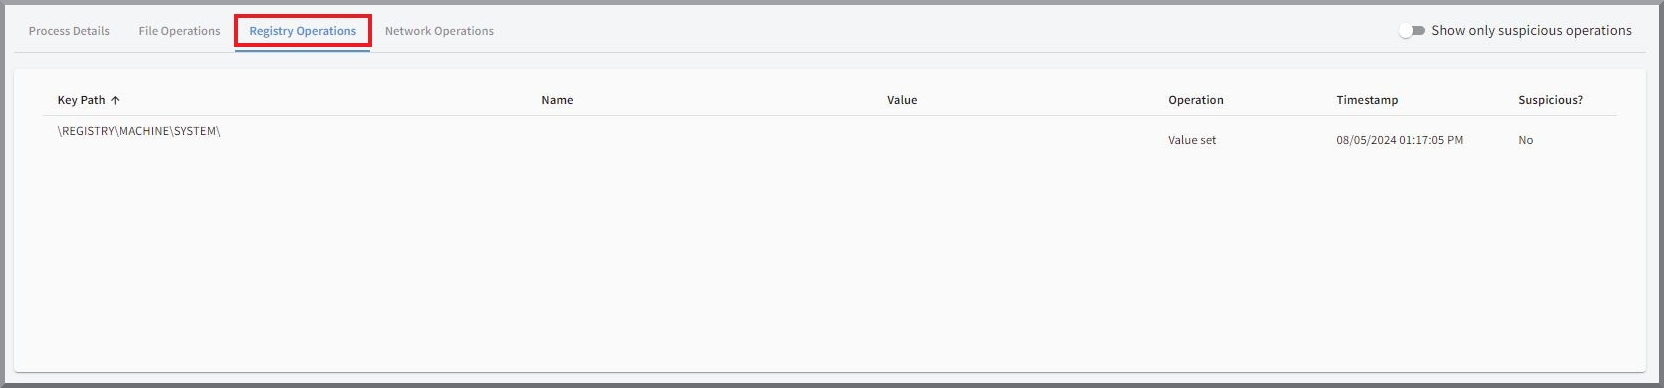
Key path |
Path of the key within the Windows Registry to which the operation refers. |
Name |
Name of the value within the key in the Registry to which the operation refers. |
Value |
Value after the operation, if present. |
Operation |
Type of operation. The options are:
|
Created |
Exact time of the operation. |
Suspicious? |
Indicates whether this is an operation that played a role in the Detection. |
Network operations
If present, all operations triggered by the process within the network are listed here. In addition to Created and type of operation, this also includes all relevant connection details.
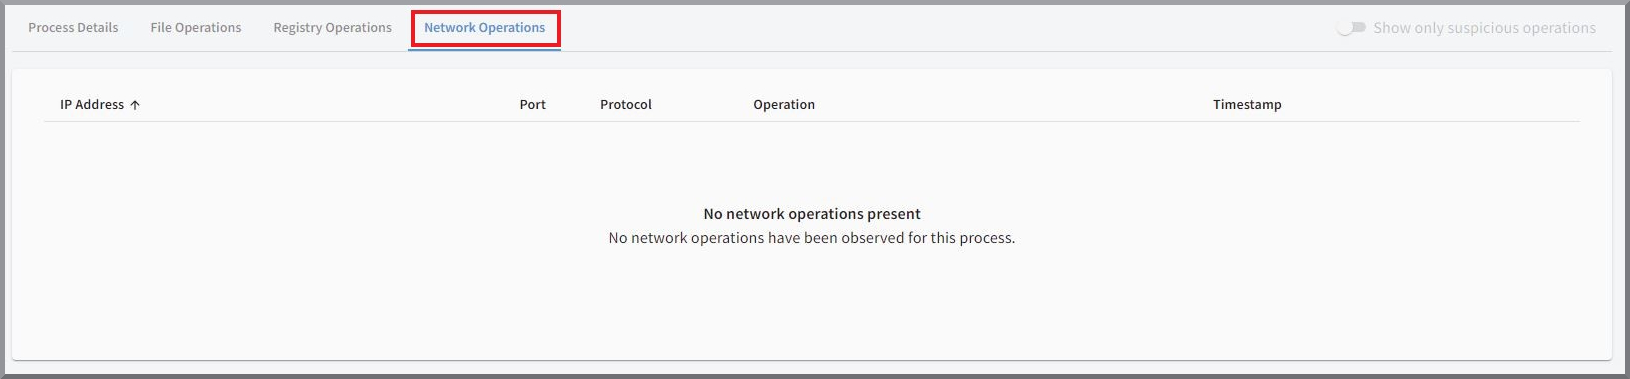
IP address |
For the "Connection established" operation, the IP address to which the connection was established. If the "Opened for inbound connections" operation is present, your own IP address is displayed here. |
Port |
Port that was used for the connection. |
Protocol |
Protocol that was used for the connection. Options are TCP or UDP. |
Operation |
Type of network operations. The options are:
|
Created |
Exact time of the network operations. |