G DATA XDR
Alerts
Security events on your Endpoints are reported to the backend by G DATA Agent. In the G DATA Web Portal, you will find all relevant information about such an event in the Alerts area.
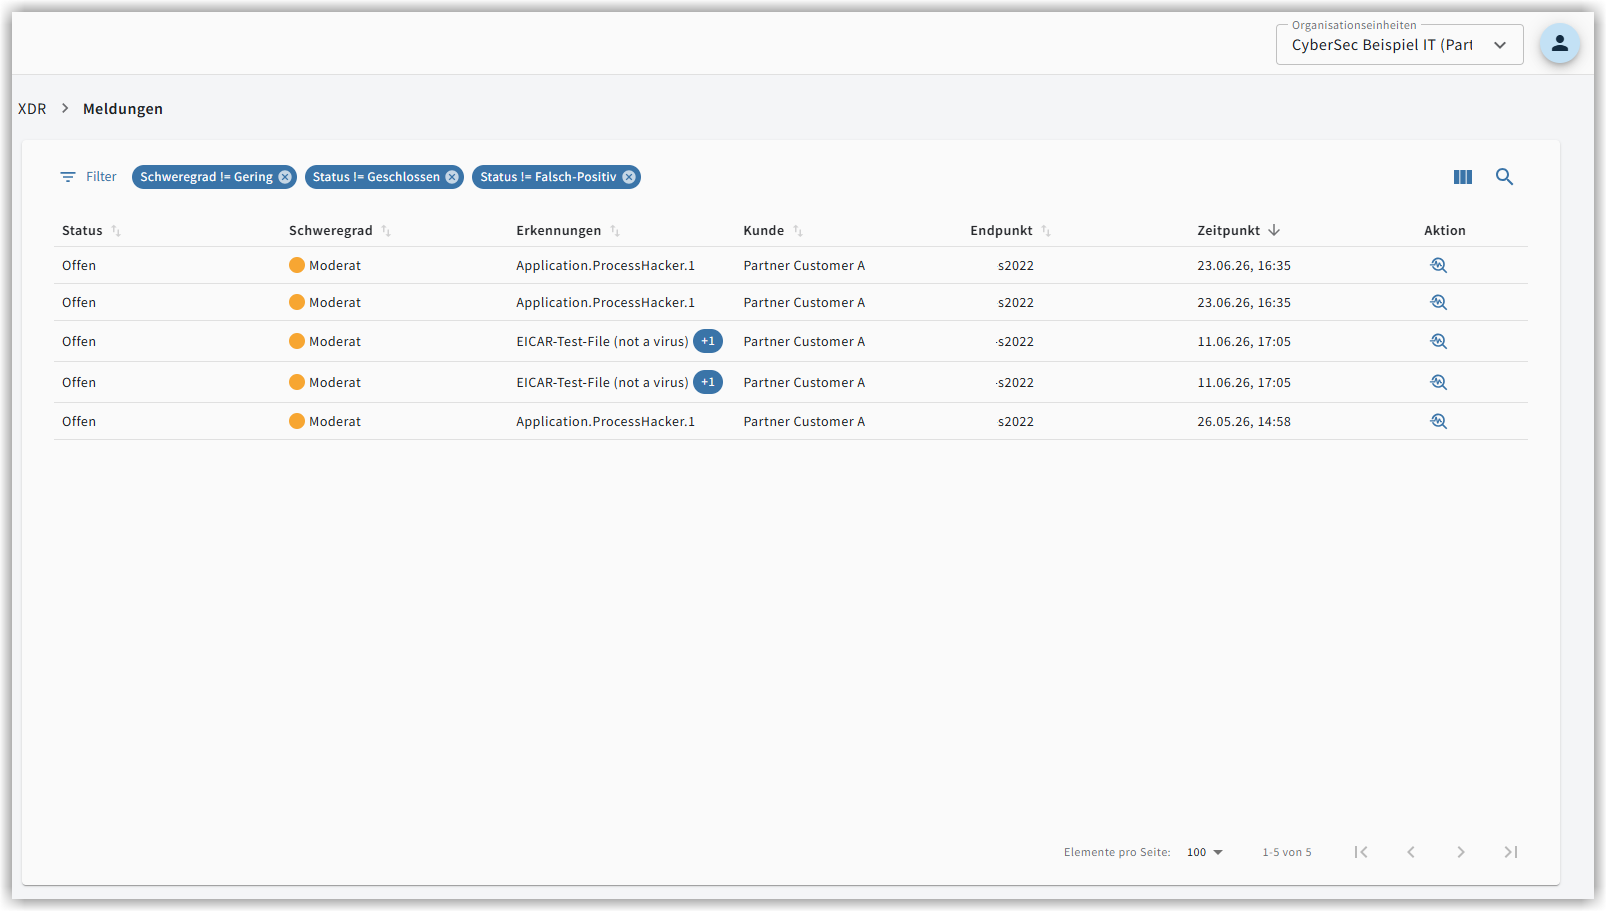
Alerts provide information about security-relevant events on the respective Endpoints and the resulting responses by G DATA Agent. This information helps you make decisions regarding necessary actions.
In the Alerts menu area, you can …
-
view and analyze new Alerts.
-
check whether and how G DATA Agent responded to an event.
-
add comments.
-
check and change the status of Alerts.
-
define events as an Exclusion.
The toolbar

Using the toolbar, you can search and filter Alerts or show/hide columns.
Filter Alerts 
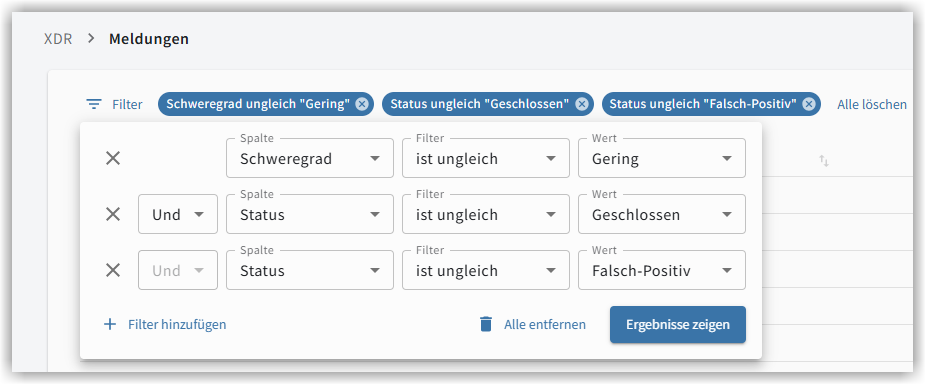
If you do not want all Alerts to be displayed in the list, you can filter the Alerts using the filter icon according to various criteria:
|
When you open the page, Alerts with low Severity, closed Alerts, and Alerts marked as False positive are already hidden by the corresponding filters. If you want to see these, you can change or clear the filters as needed. |
| Column | Filter | Value |
|---|---|---|
Status (default filter, which is set to not equal closed and not equal False positive when the page is opened) |
equal (=) |
Open |
Severity (default filter, which is set to low when the page is opened) |
equal (=) |
Low |
Detections |
contains |
String entered in the value field (free text) |
Customer |
contains |
String entered in the value field (free text) |
Endpoint |
contains |
String entered in the value field (free text) |
Created |
is before |
Free input or calendar selection |
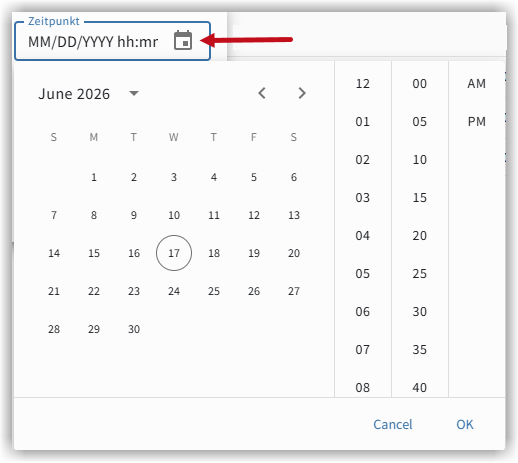
By clicking  you can add additional filters.
|
When you add the first filter, you have the option to select the filter logic (AND or OR). 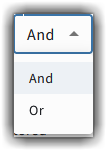
All additional filters are linked to each other using the filter logic selected first. A different selection is no longer possible at this point. |
Select columns 
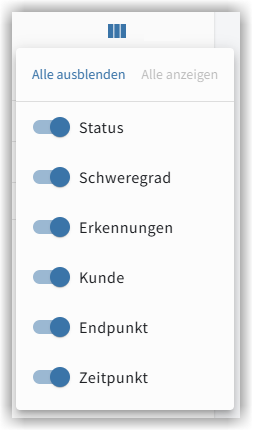
Using the columns icon, you can show or hide the available columns.
Search Alerts 
Using the search icon, you can quickly and easily search for Alerts. Enter free text in the search field. You will then be shown the Alerts for which matches were found.
The alert overview

The overview displays existing Alerts in list form. Here you can see the most important information about an Alert in summarized form.
You will see…
-
the status of the Alert: Open, Closed, False positive.
-
the Severity of the Detection: Low, Moderate, High.
-
the name of the Detection.
-
the Customer where the Detection occurred (G DATA partner feature).
-
the name of the Endpoint where the Detection occurred.
-
the Created time of the Detection.
-
the action button
 , which you can use to open the Detail Page for the Alert.